Machine Learning By Andew Ng - Week 4
Motivations
Non-linear Hypothesis
-
Representation
-
Problem
-
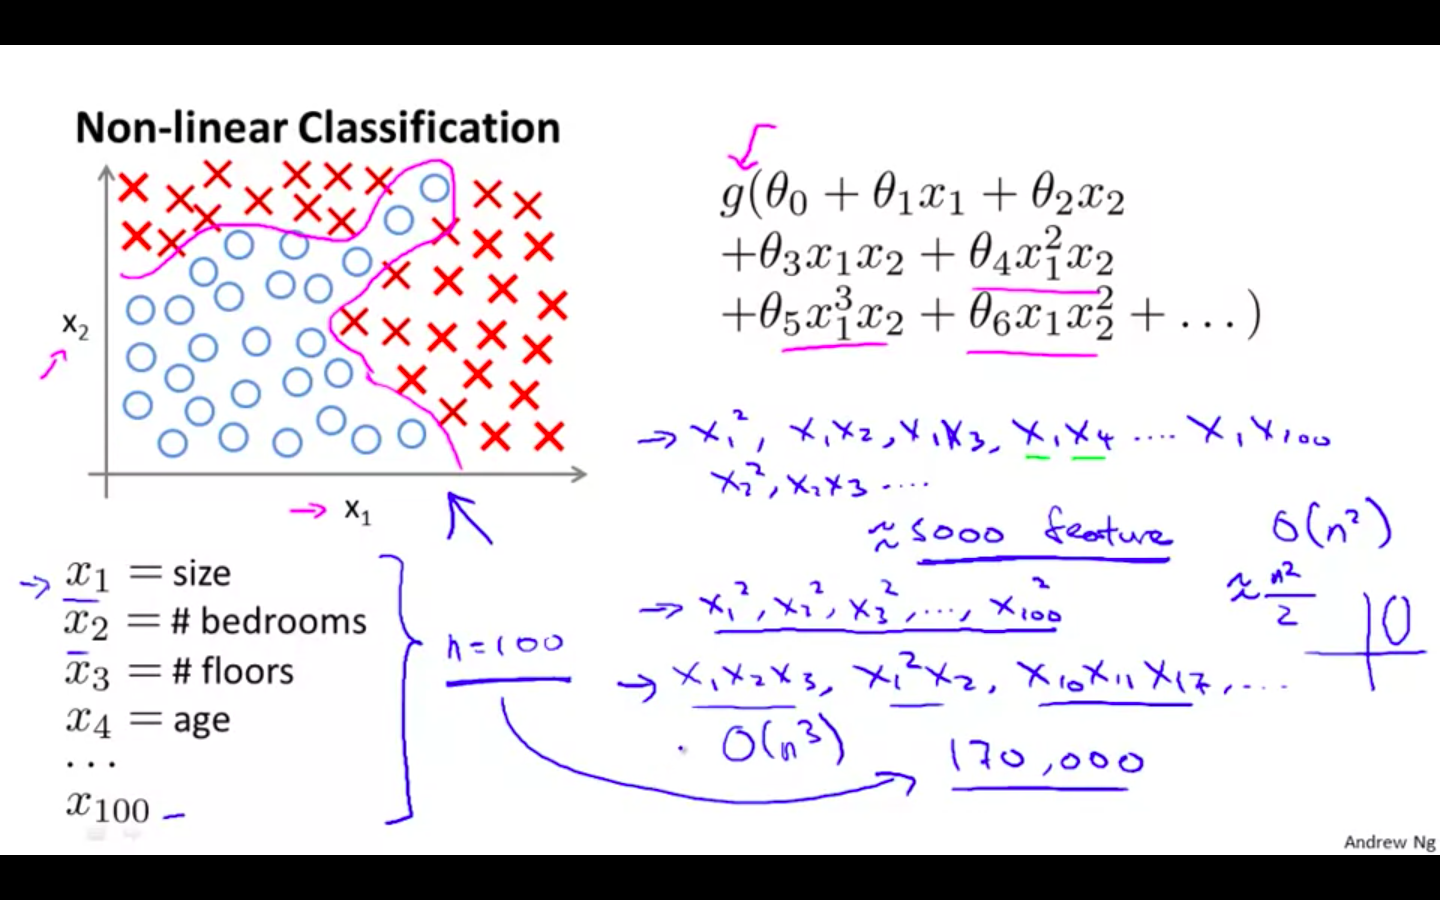
For non-linear classification, hypothesis is a high order polynomial
-
if it is a quadratic function of 100 features, hypothesis will be close to 5000 features
- Time Complexity is O ( n^2 )
-
if it is a cubic function of 100 features, hypothesis will be close to 1,70,000
-
-
-
Computer Vision
-
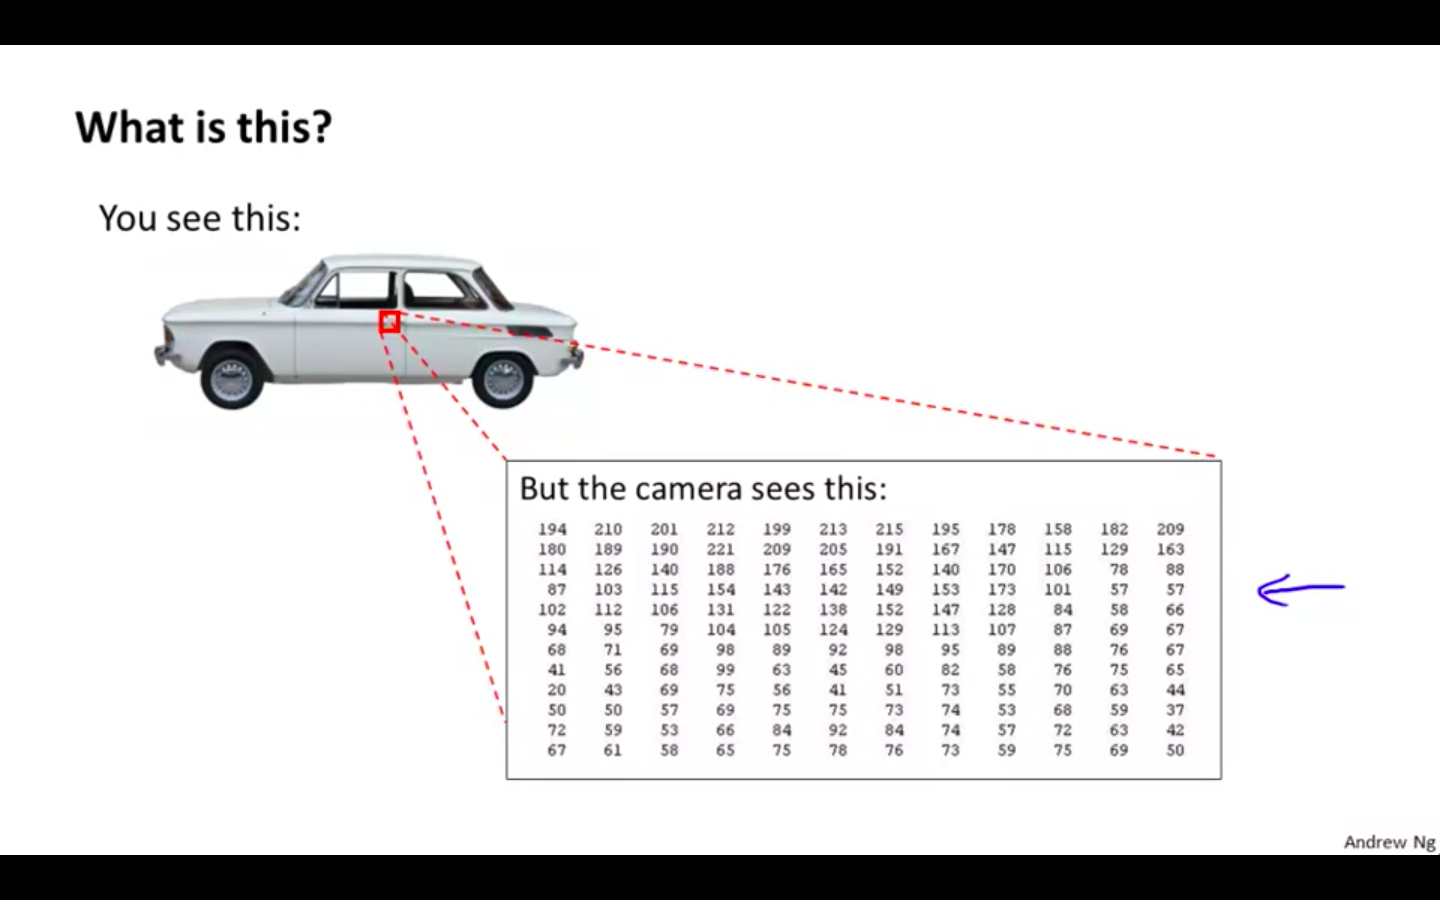
Why it is hard ?
- Computer see the matrix of pixel density of the image
-
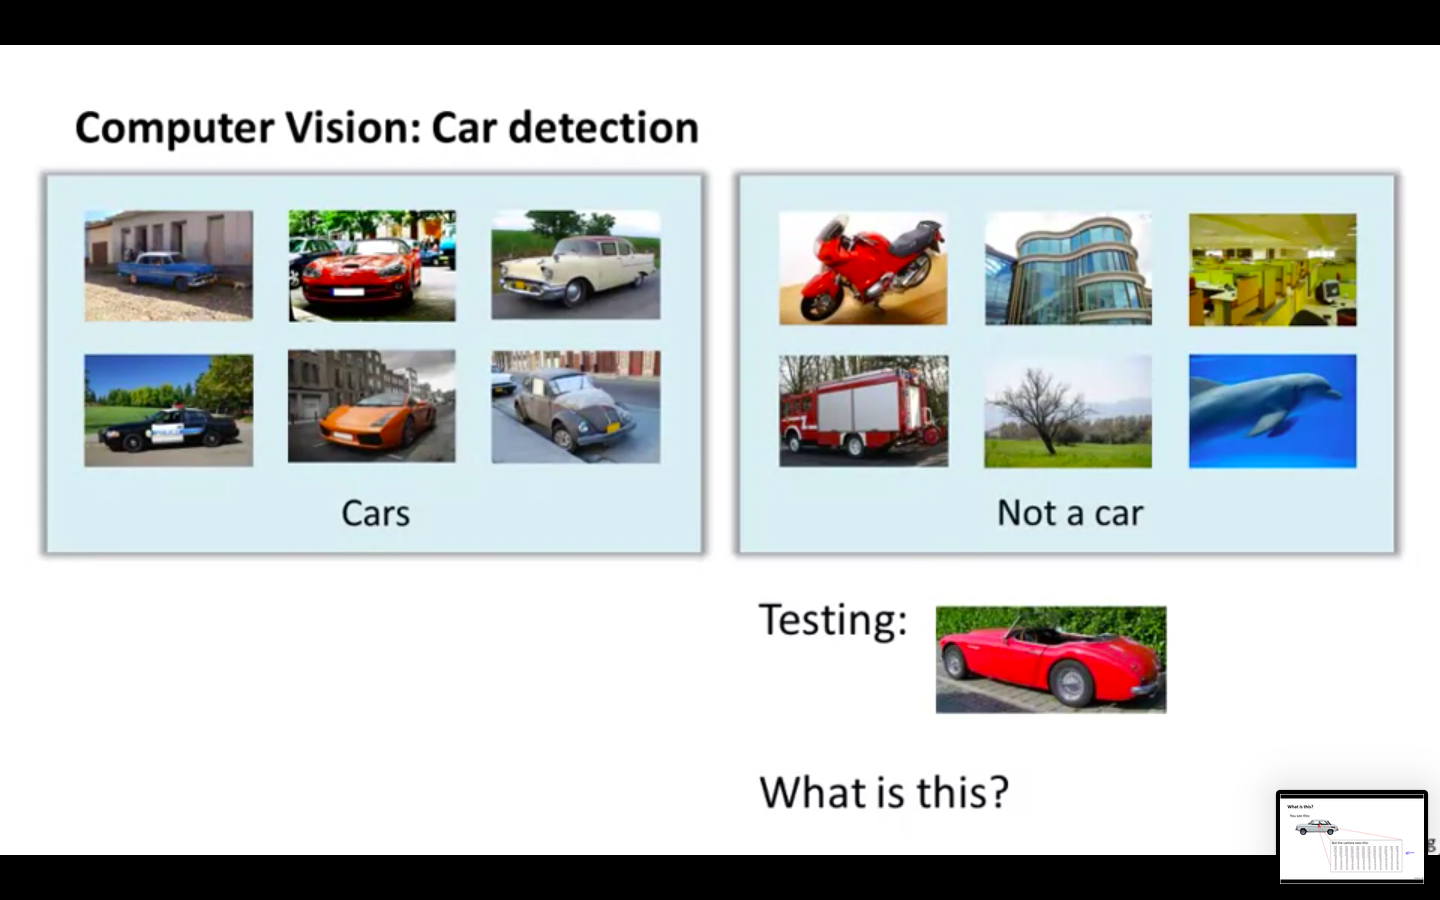
How does it work?
-
We give the classifier image of cars with labels and not images of cars with labels, it train on them.
-
We give a test image to predict, if it’s a car or not car.
-
-
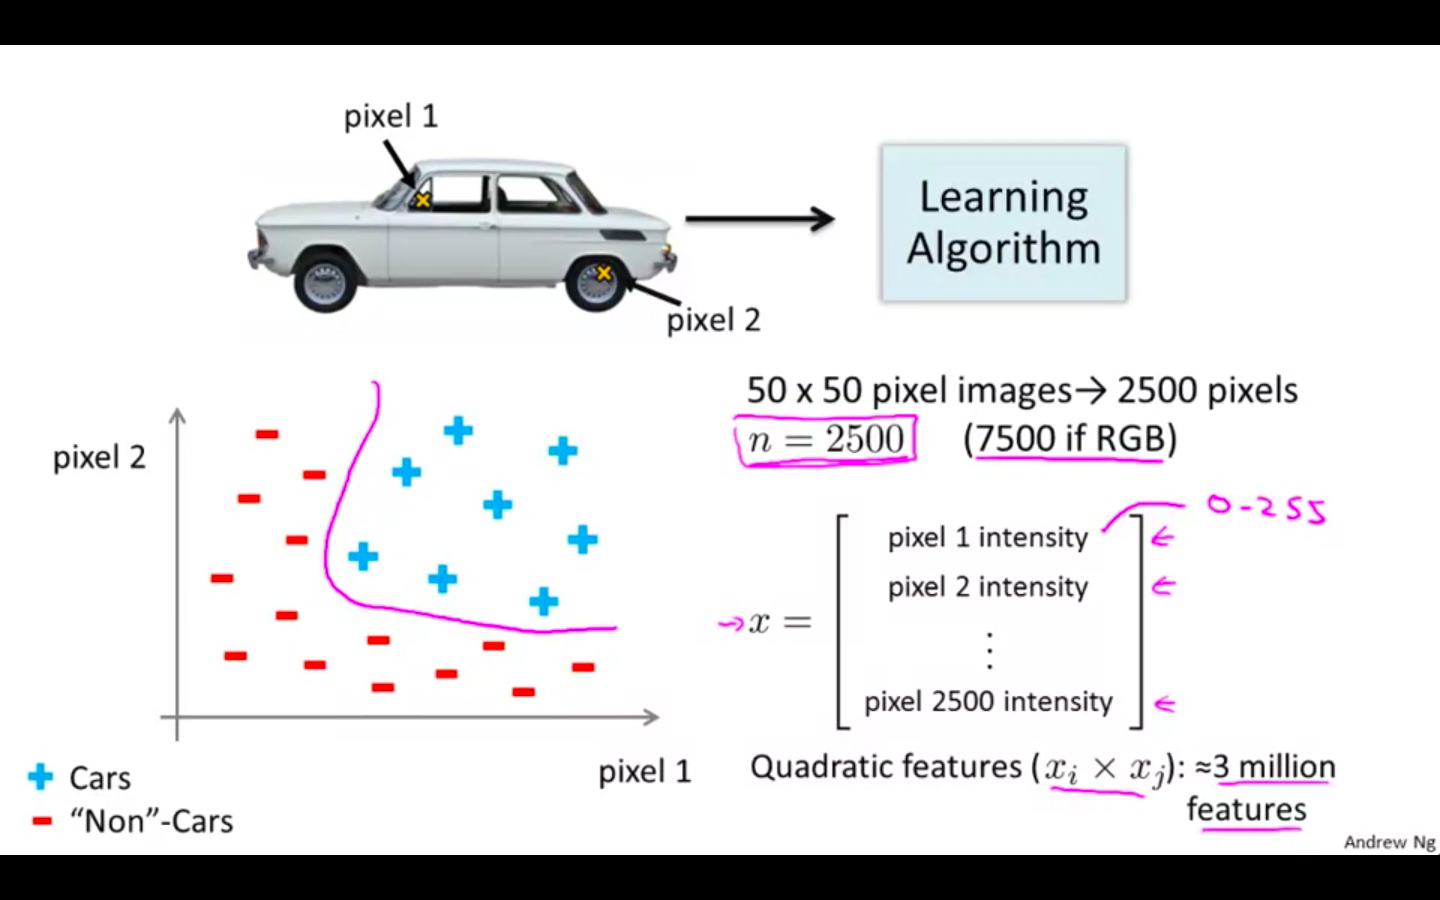
If we have 50 x 50 pixels images, then the n will 2500 ( greyscale ) 7500 ( RGB )
Neurons and the Brain
-
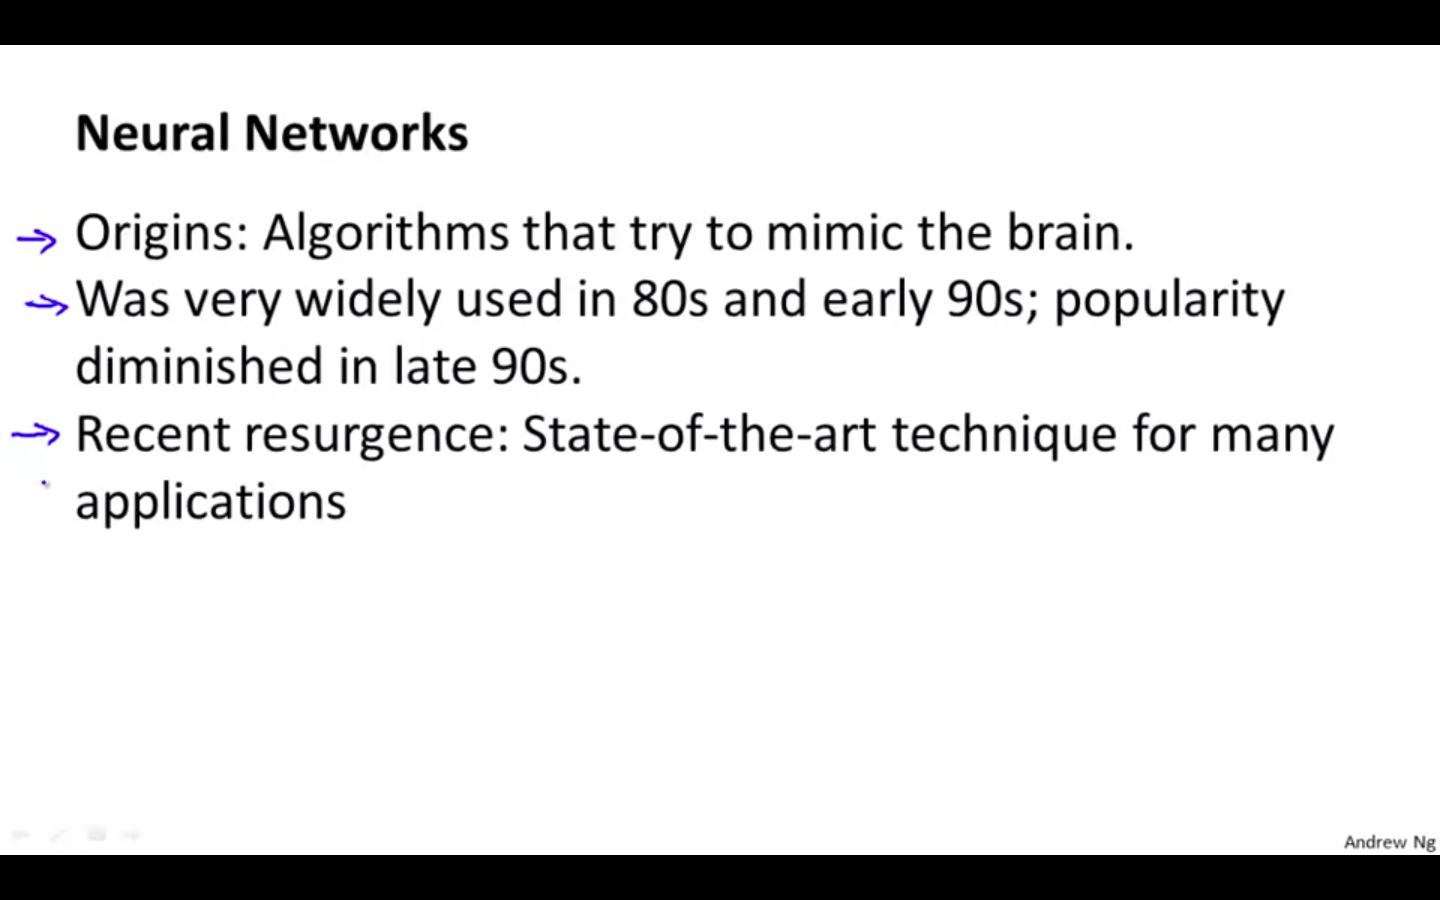
Neural Networks
- Origin: Algorithms that try to mimic the brain
-
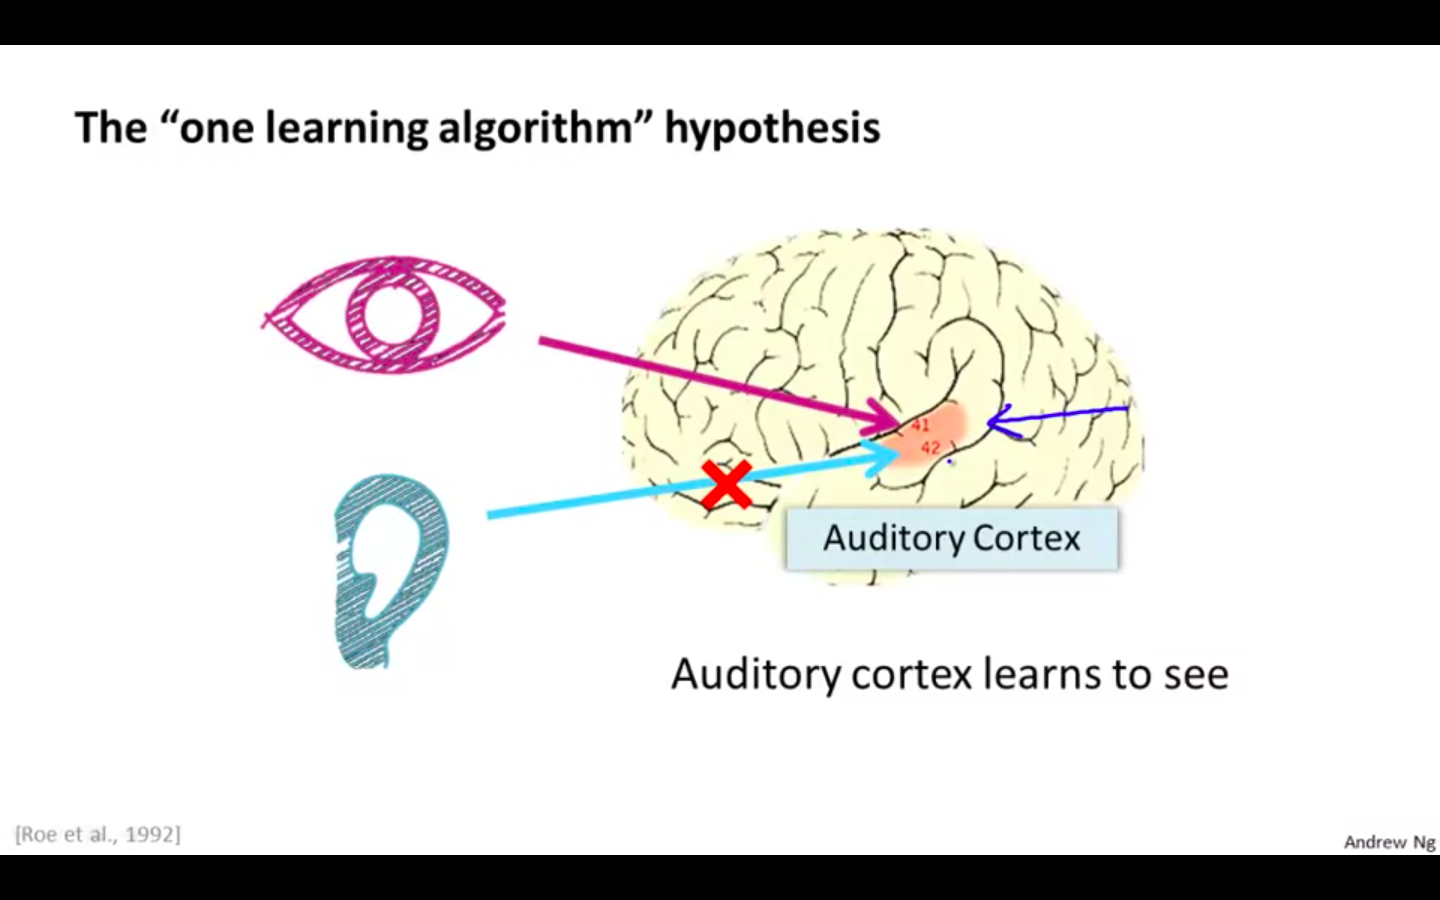
Neural Rewiring Experiments
- Rewiring the auditory cortex with eyes rather than ears, it learns to see or visual discrimination with that tissue
- In the same way, by rewiring the somatosensory cortex with the eyes rather than the hands, it learns to visual discrimination with that tissue
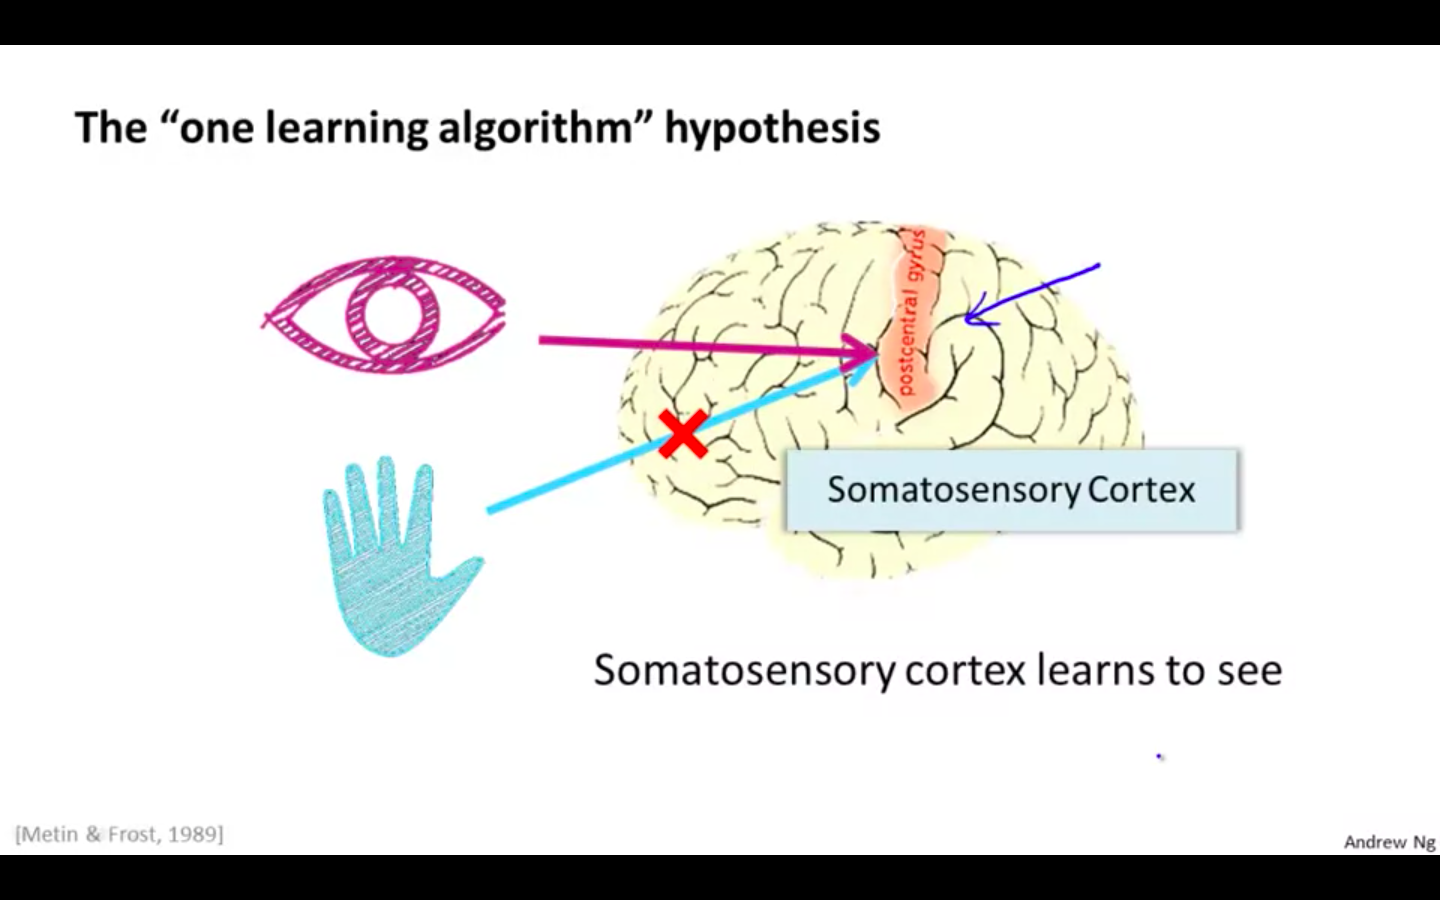
- It is “ one learning algorithm “, whatever input it receives it generalises it perform that particular task.
-
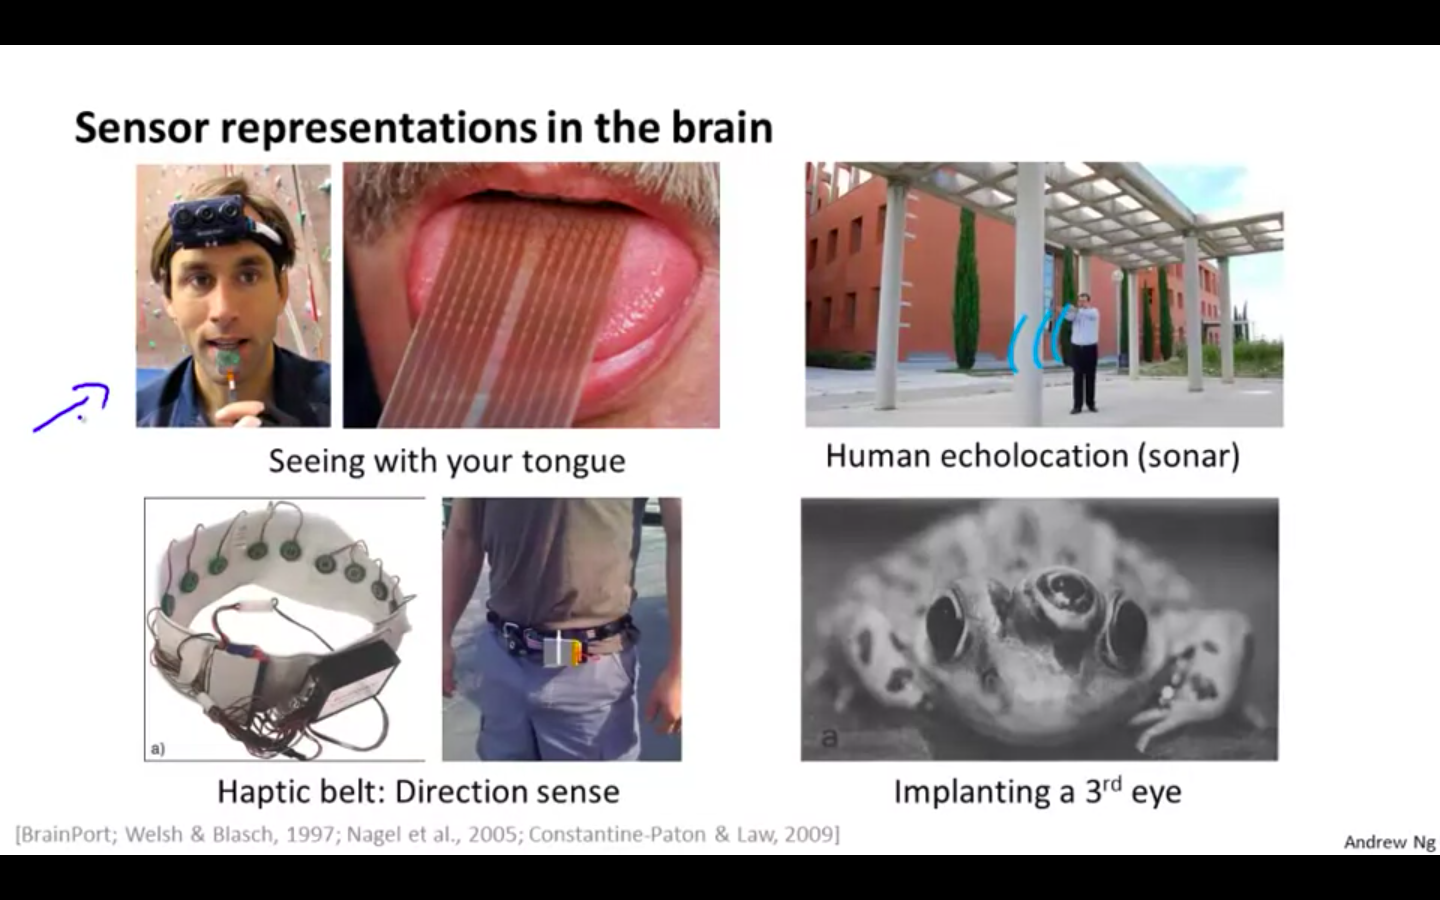
Examples
-
Seeing with your tongue
-
Human echolocation
-
Haptic Belt
-
Implementing 3rd eye in the frog
-
Neural Networks
Model Representation 1
-
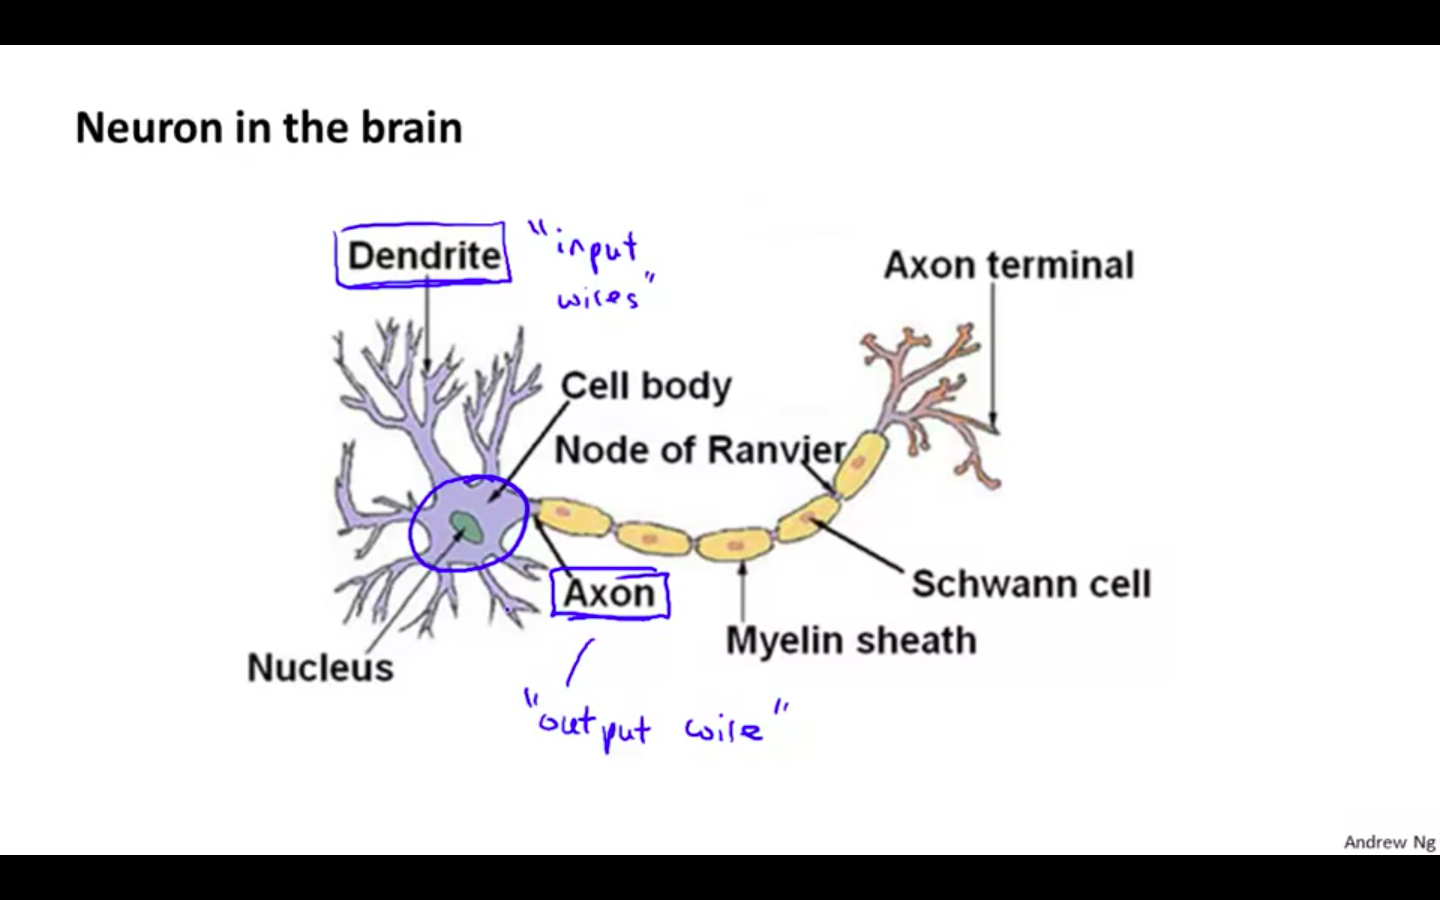
Neurons
-
There are input wires called ‘Dendrites’.
-
There are output wire called ‘Axon’
-
There is also cell body and nucleus
-
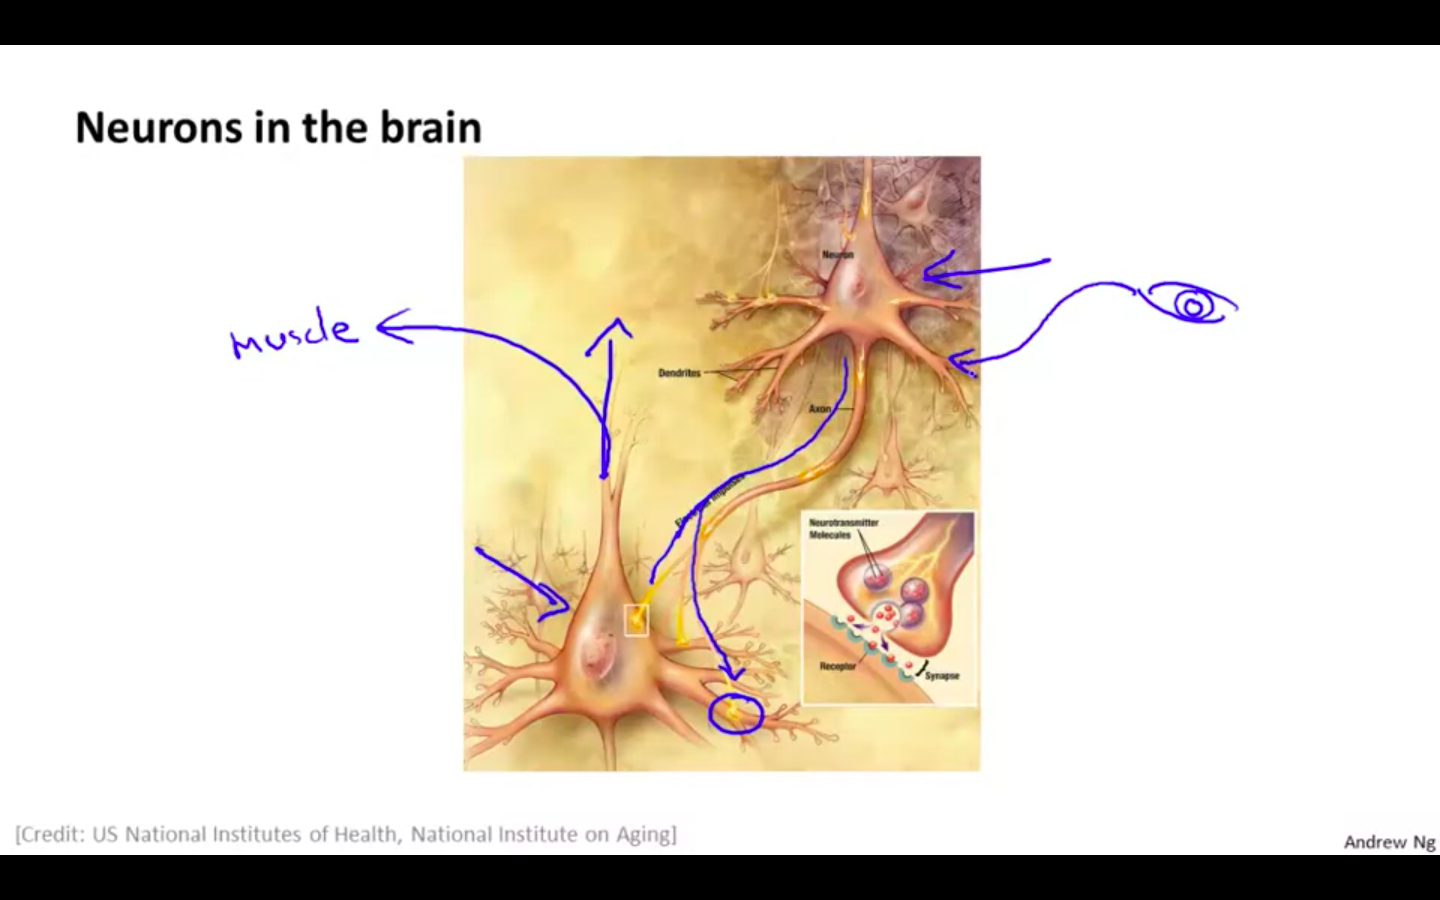
Working of a Neuron
-
One neuron sends information to other neuron by sending electric pulses ( called “spikes” )
-
Axon terminal of one neuron is connected to the dendrites of the other neuron
-
-
-
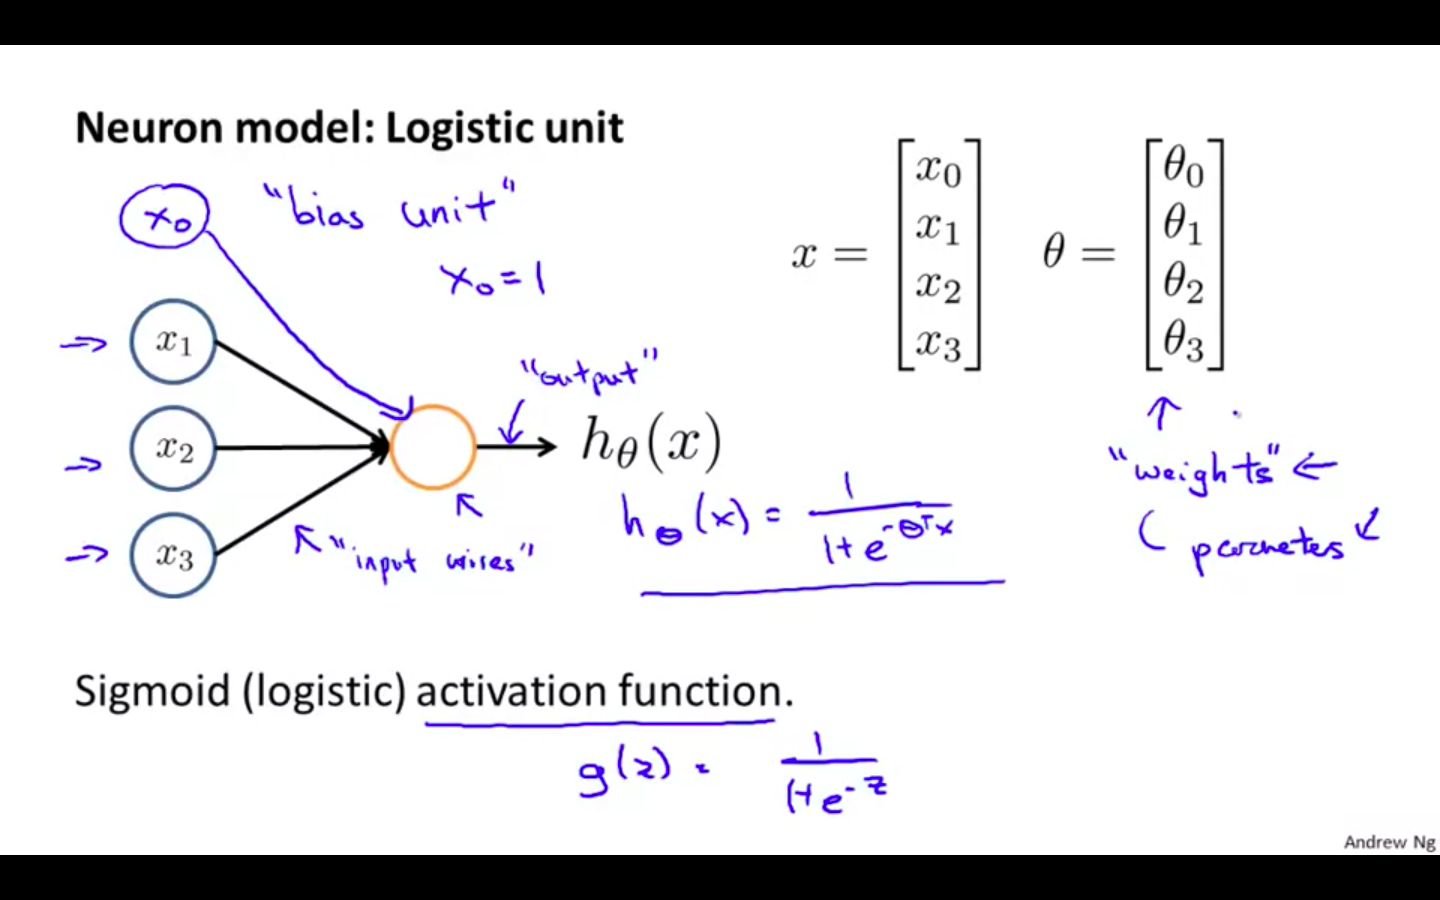
Neuron Model
-
In our model, our dendrites are like the input features ( x_1, …. x_n ) and the output is the result of our hypothesis function.
-
In this model our x_0 input node is sometimes called the “bias unit.” It is always equal to 1.
-
Parameters are also called as weights
-
x_0 is a bias unit
-
Sigmoid ( logistic ) activation function
- activation function = Hypothesis of logistic
-
-
-
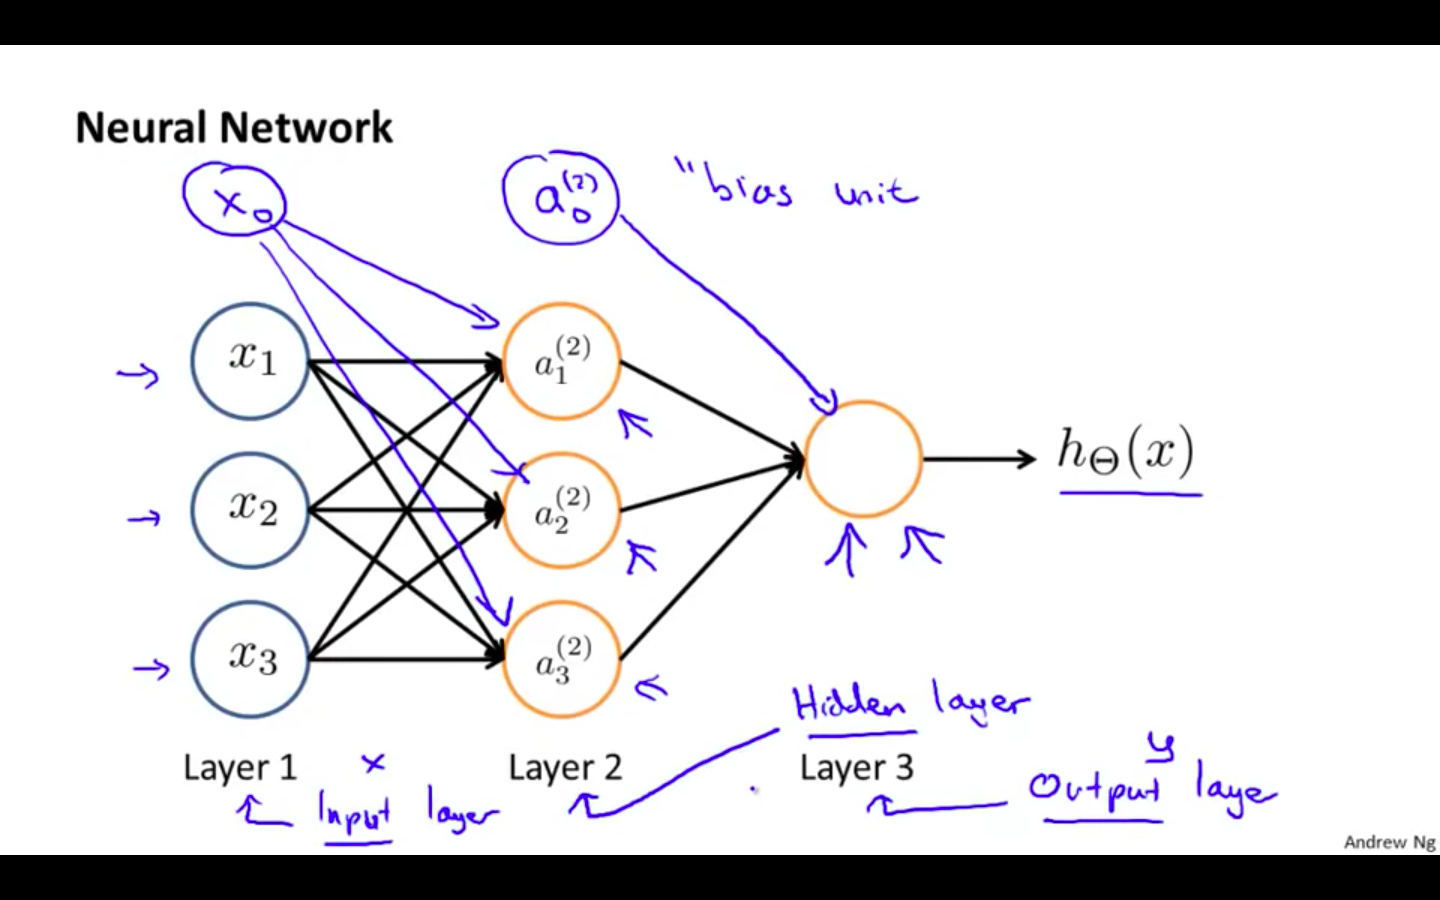
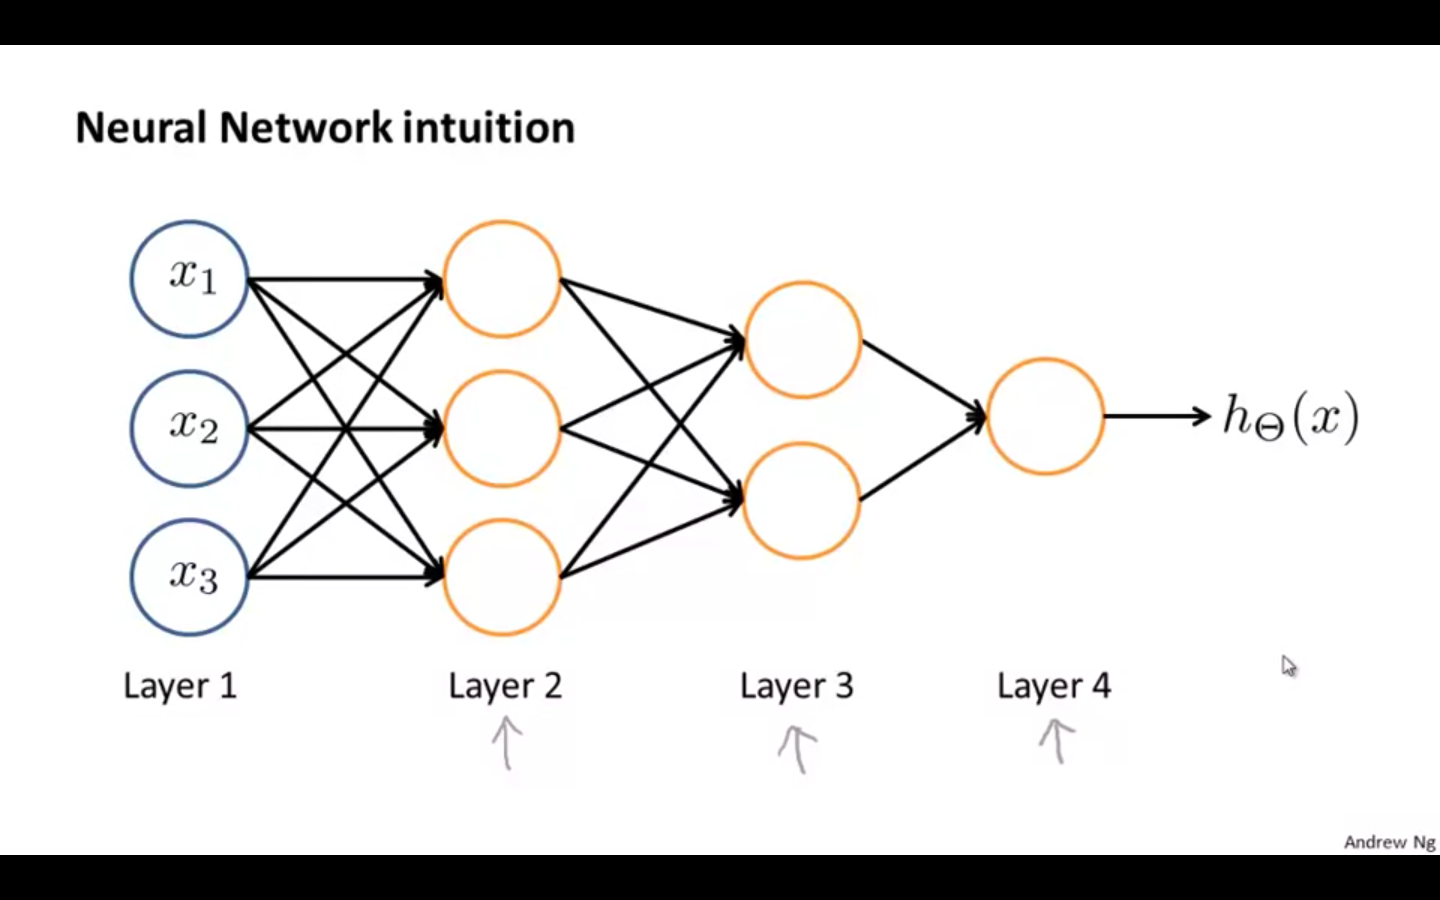
Artificial Neural Network
-
First layer is called as the input layer ( x )
-
Last layer is called as the output layer ( y )
-
Layer between the first and the last layer is called as the hidden layer
-
First unit of the layer is called the bias unit
-
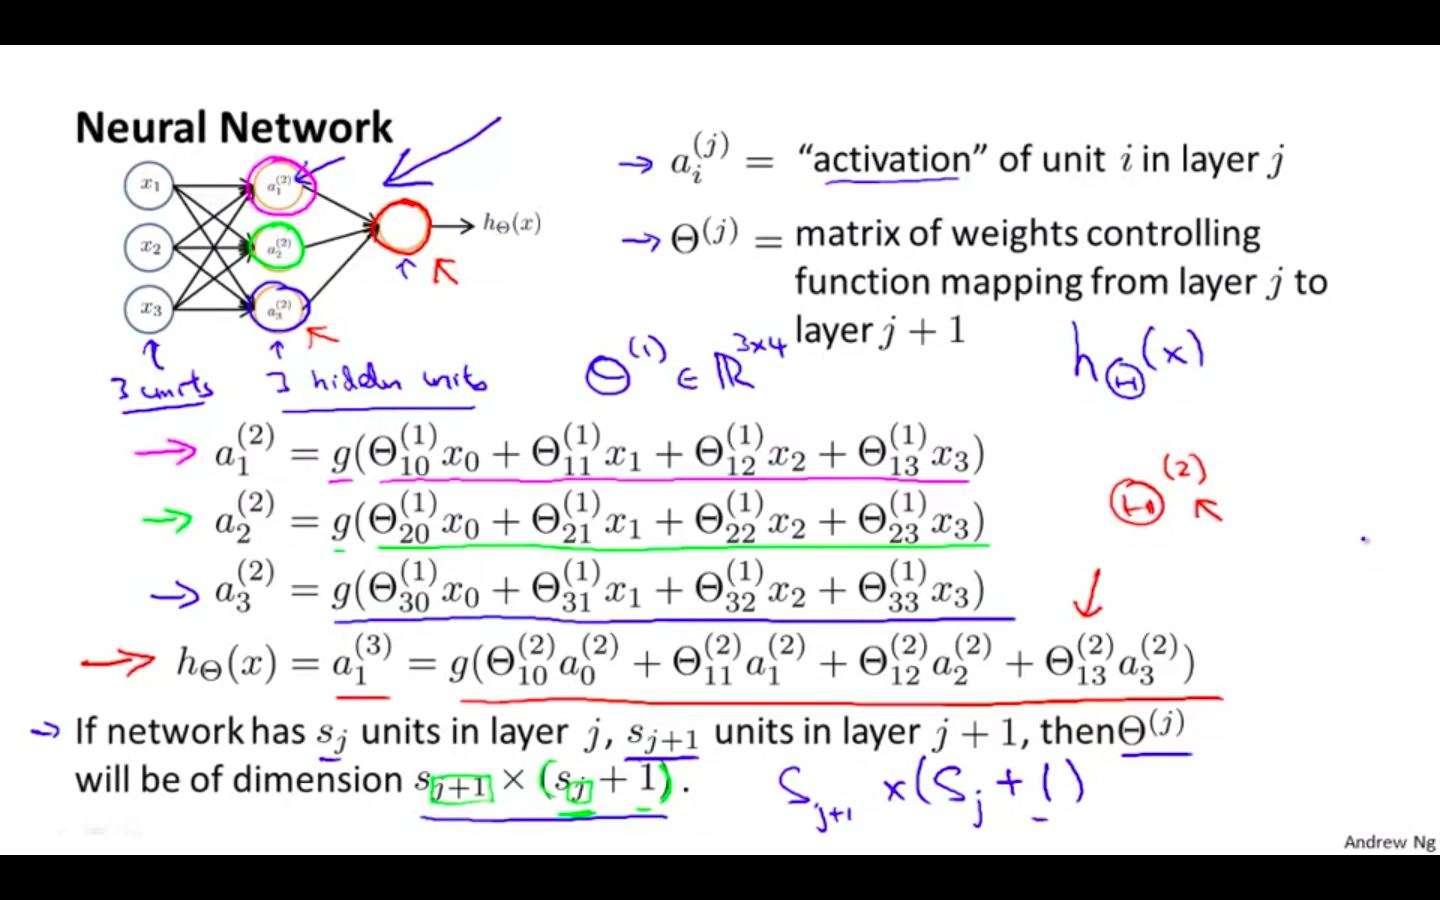
a_i^j = “activation” of unit i in layer j
-
theta^j = matrix of weight controlling function mapping from layer j to layer j + 1
-
If network has s^j unit in layer j, s^j+1 units in layer j + 1, then theta^j will be of dimension s_j+1 x (s_j + 1)
-
We apply each row of the parameters to our inputs to obtain the value for one activation node.
-
Our hypothesis output is the logistic function applied to the sum of the values of our activation nodes, which have been multiplied by yet another parameter matrix theta^2 containing the weights for our second layer of nodes.
-
Model Representation 2
-
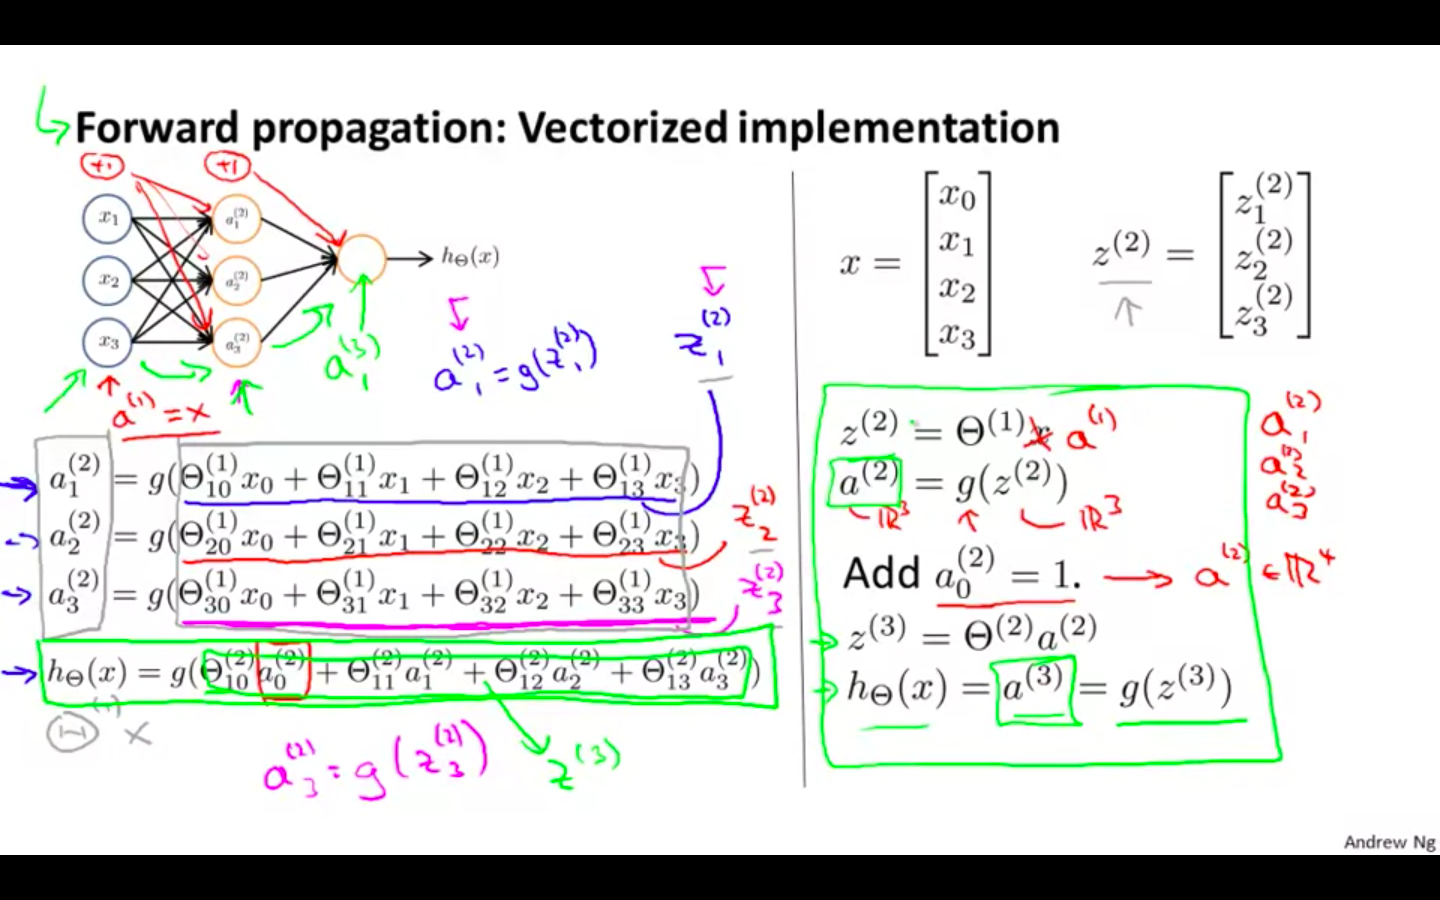
Forward Propagation
-
Activation flows from input layer to output layer
-
vectorised implementation of the above functions.
-
Notice that in this last step, between layer j and layer j+1, we are doing exactly the same thing as we did in logistic regression.
-
Adding all these intermediate layers in neural networks allows us to more elegantly produce interesting and more complex non-linear hypotheses.
-
-
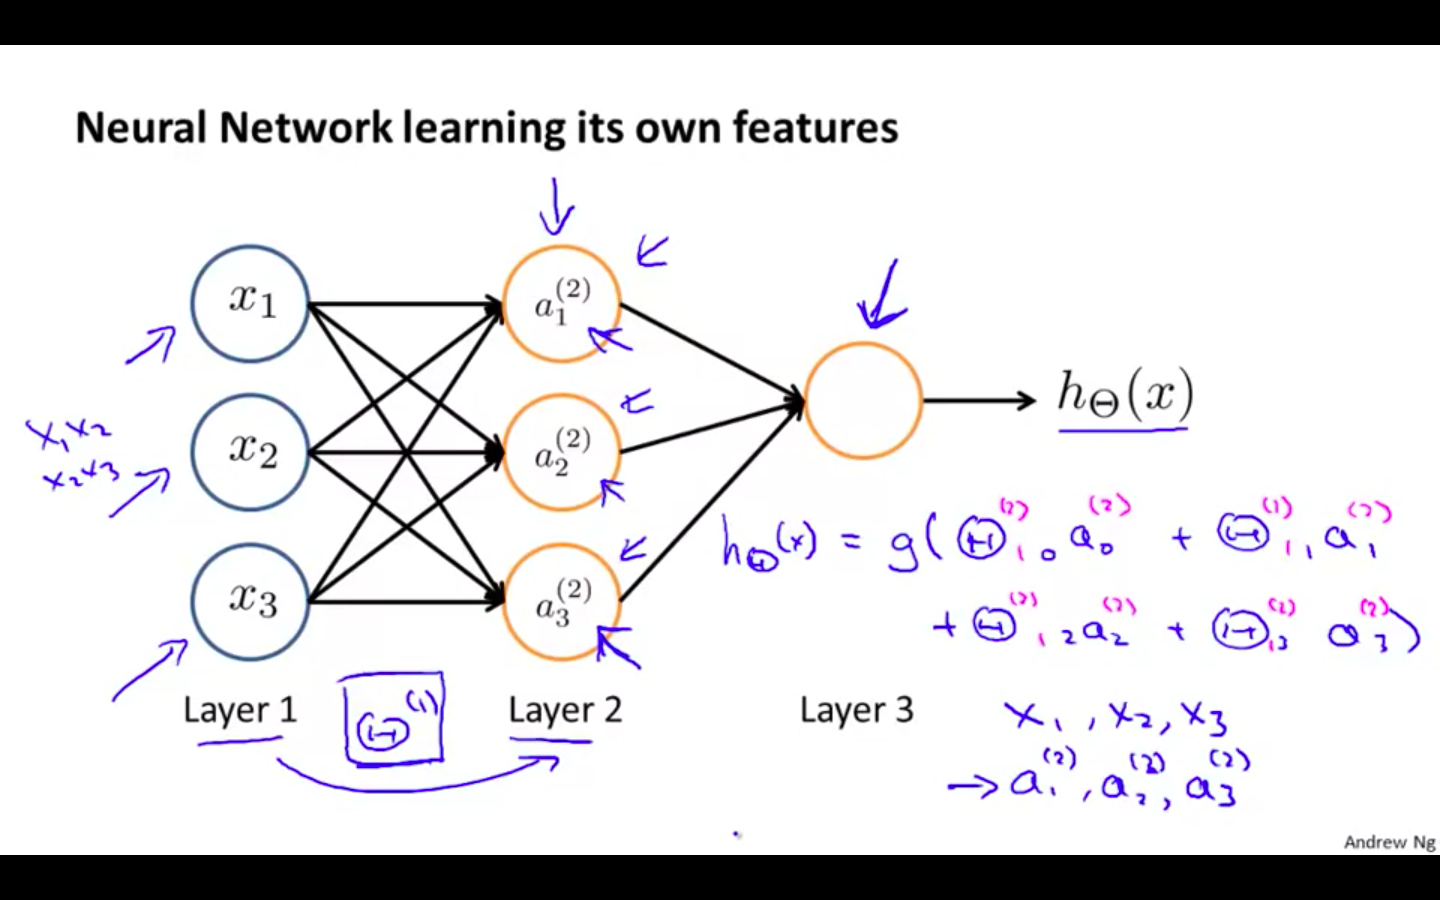
Neural Network learning it’s own features
-
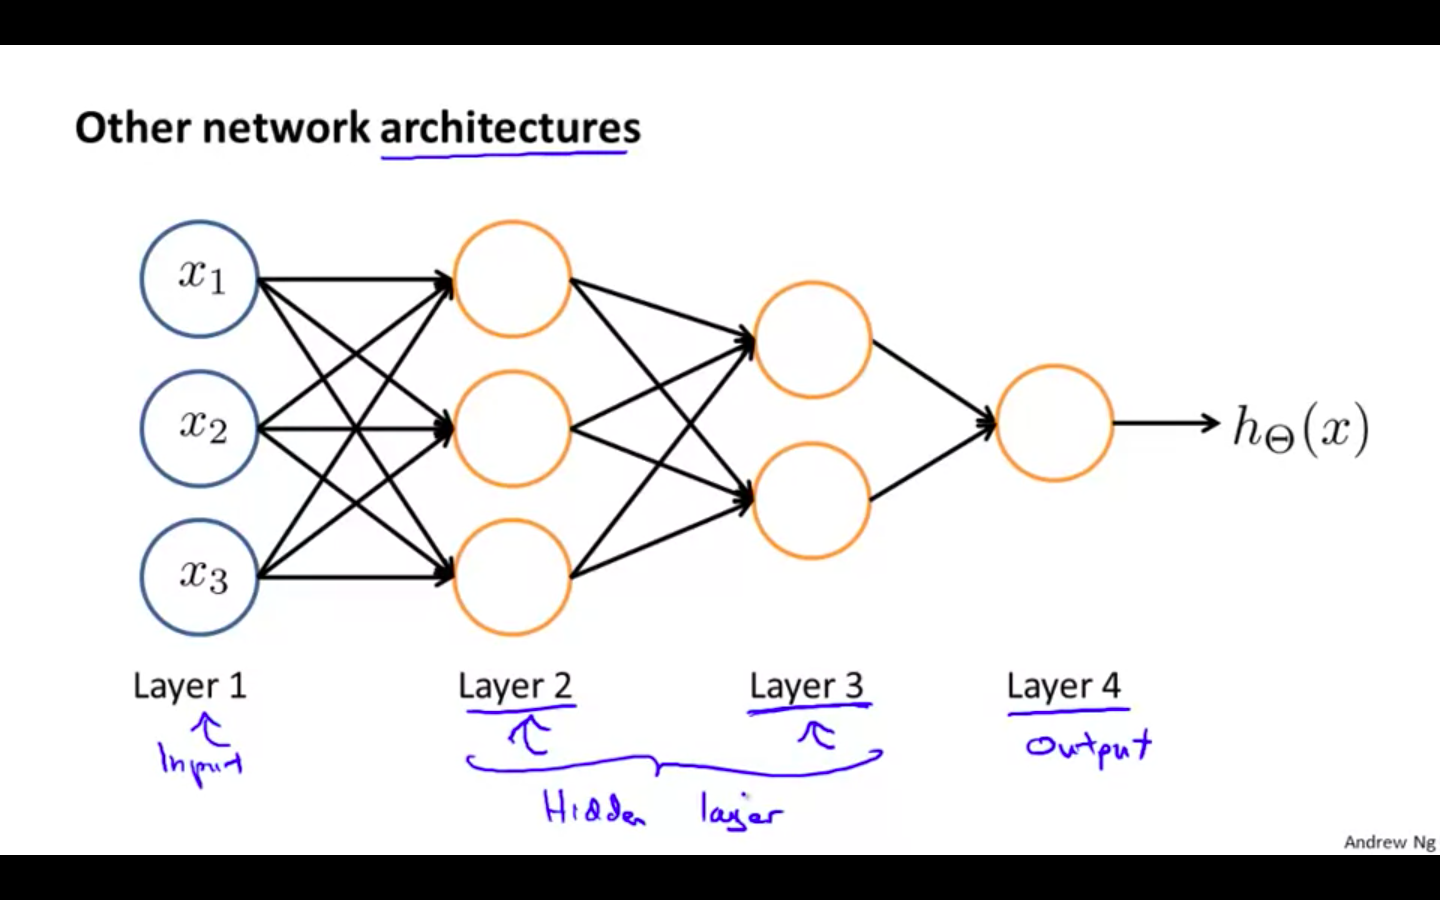
Other Neural Network architectures
Applications
Examples and Intuitions 1
-
XOR / XNOR
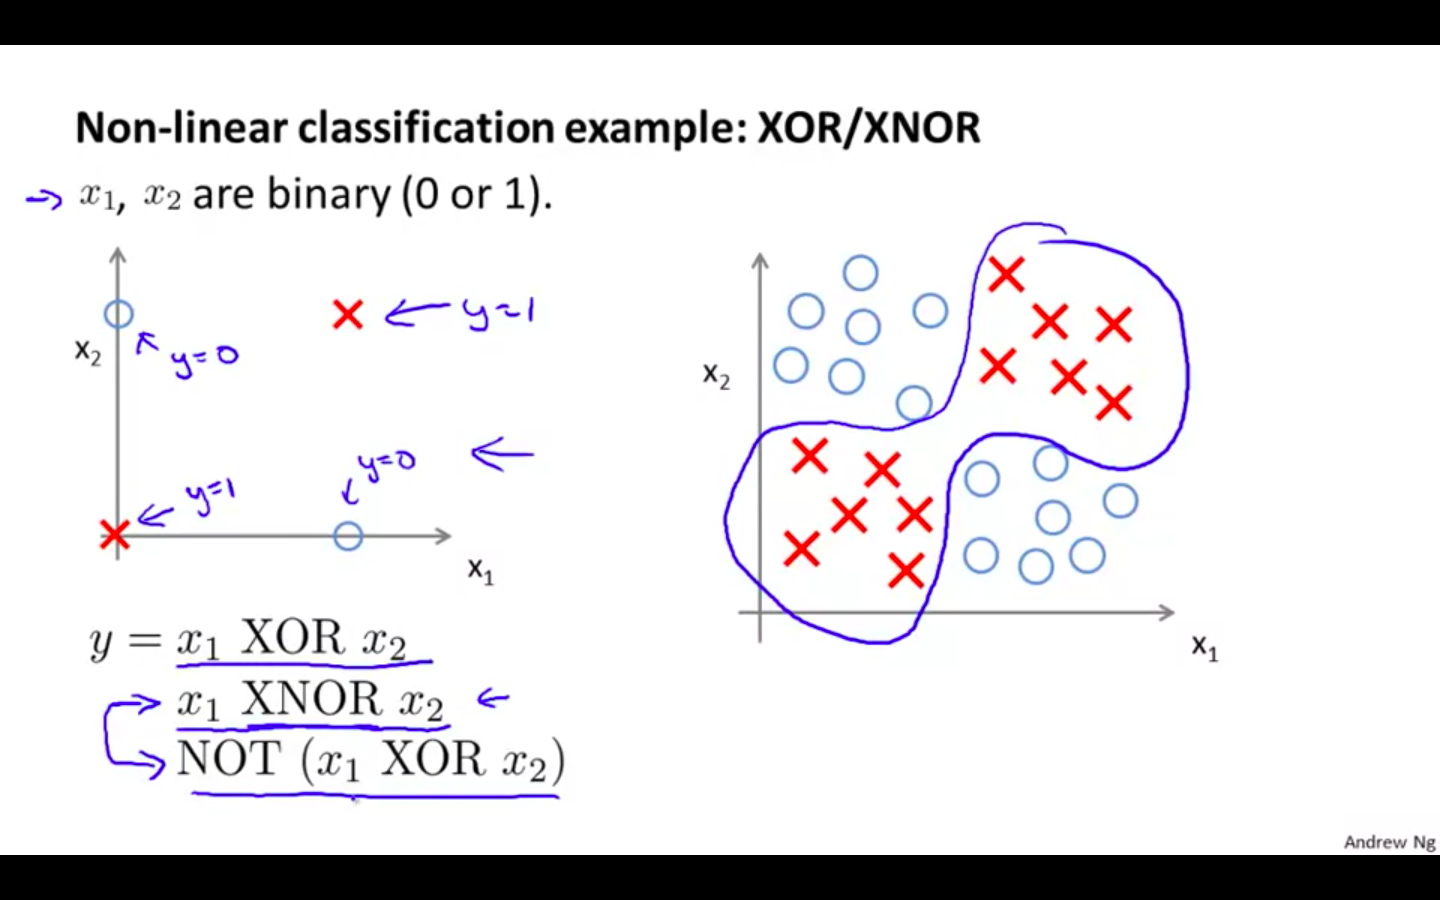
-
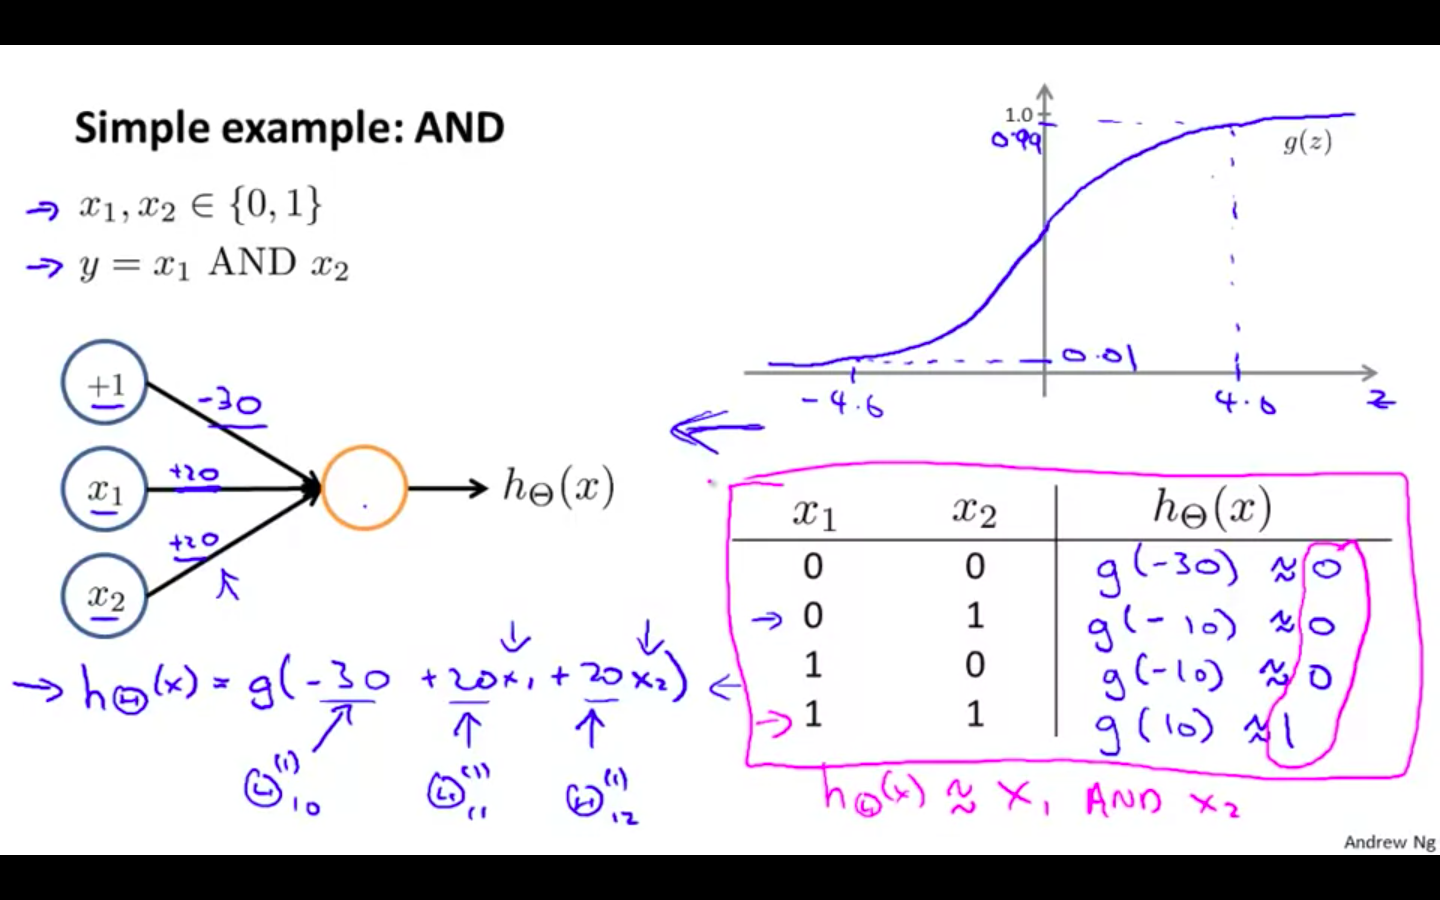
AND
- A simple example of applying neural networks is by predicting x_1 AND x_2, which is the logical ‘and’ operator and is only true if both x_1 and x_2 are 1
-
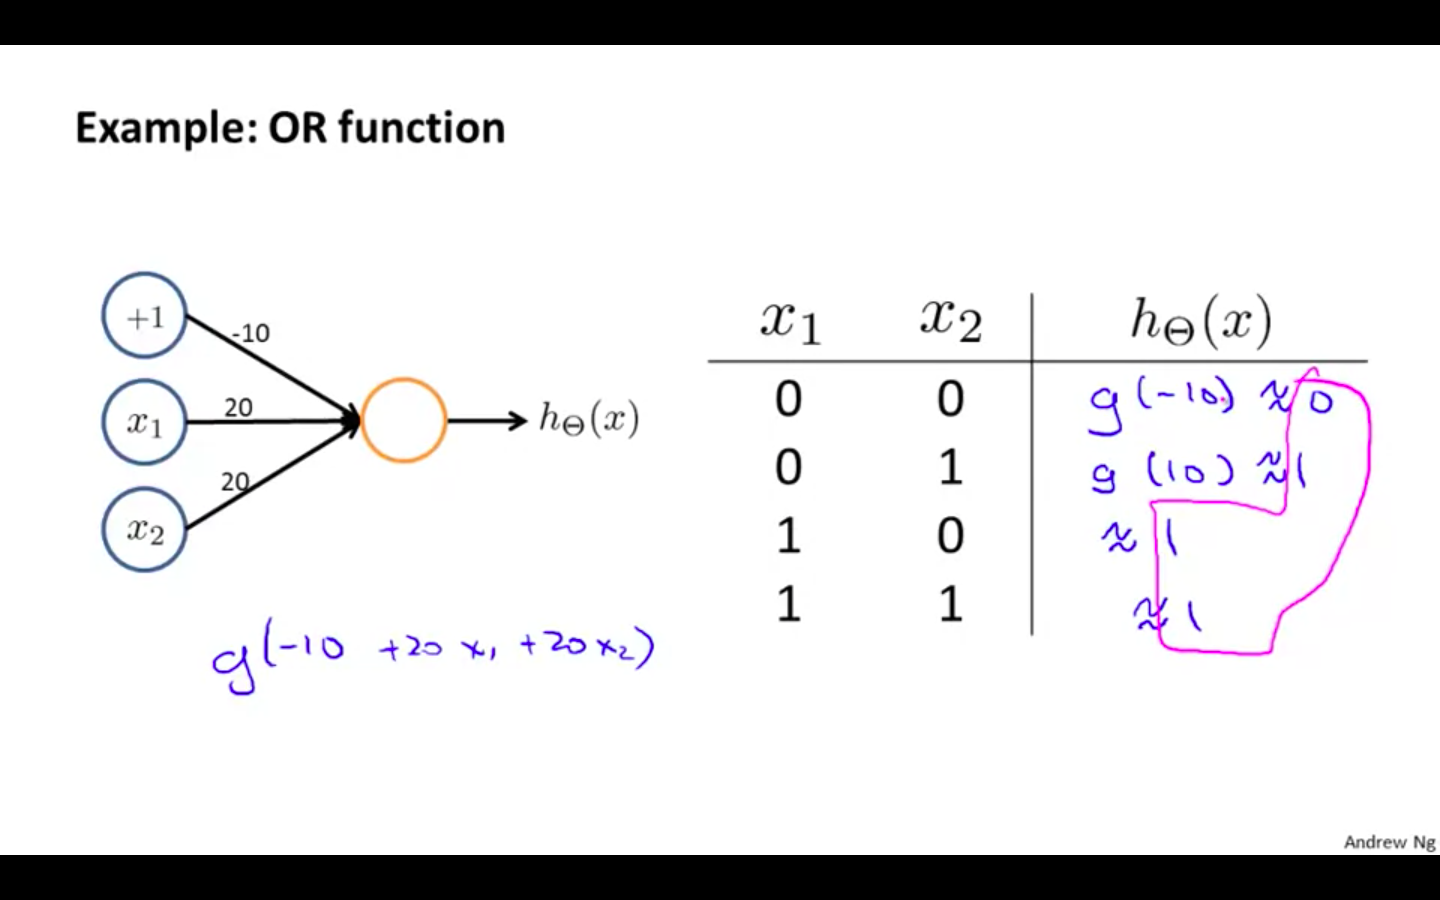
OR
-
Neural networks can also be used to simulate all the other logical gates.
-
The following is an example of the logical operator ‘OR’, meaning either x_1 is true or x_2 is true, or both
-
Examples and Intuitions 2
-
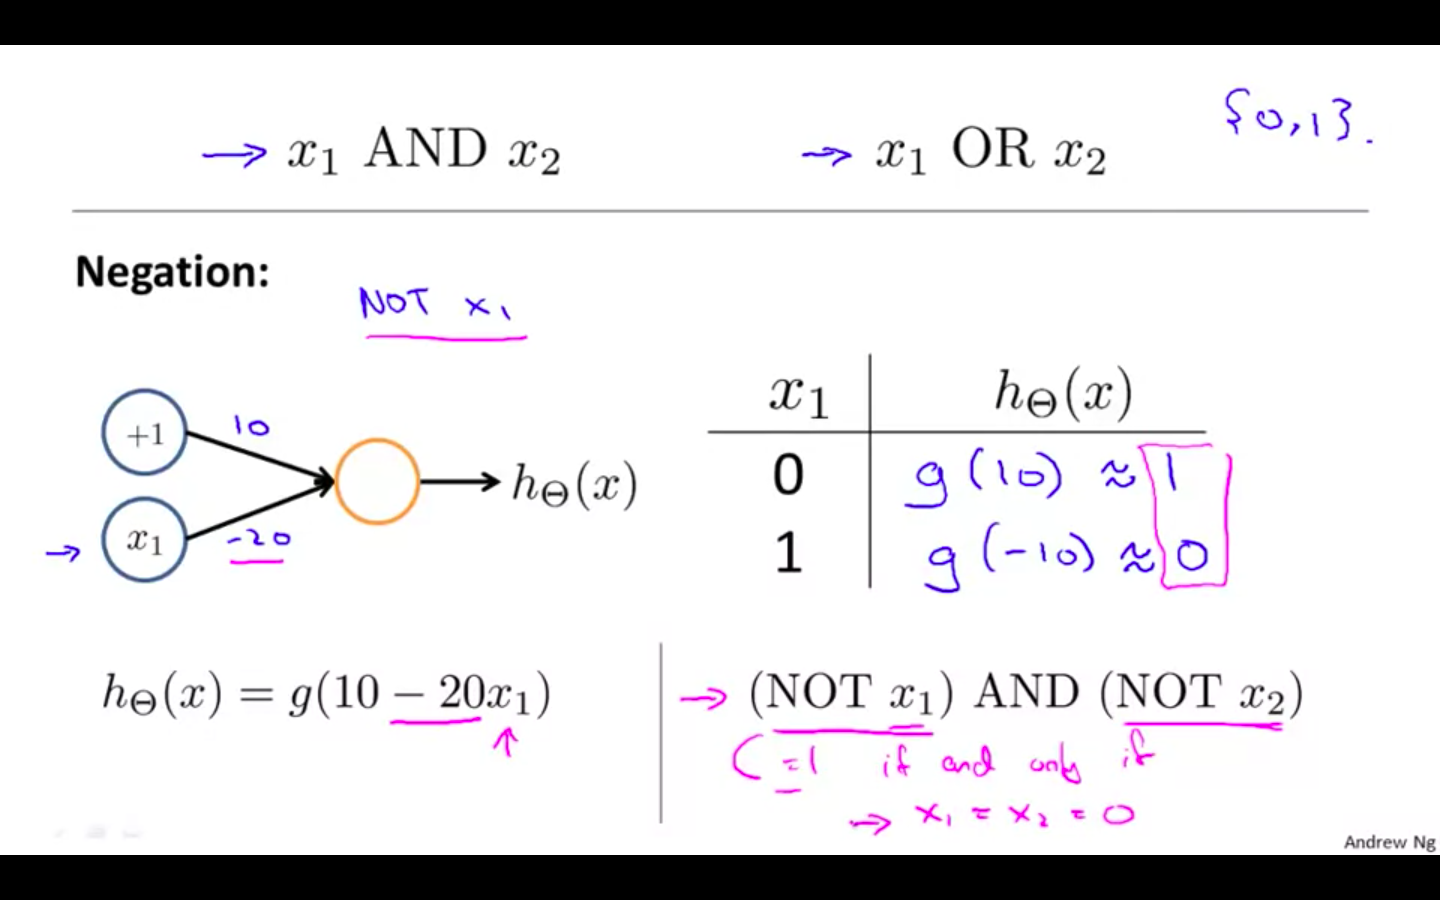
Negation
-
XNOR
- Combining AND, NOT and OR function we have a XNOR operator
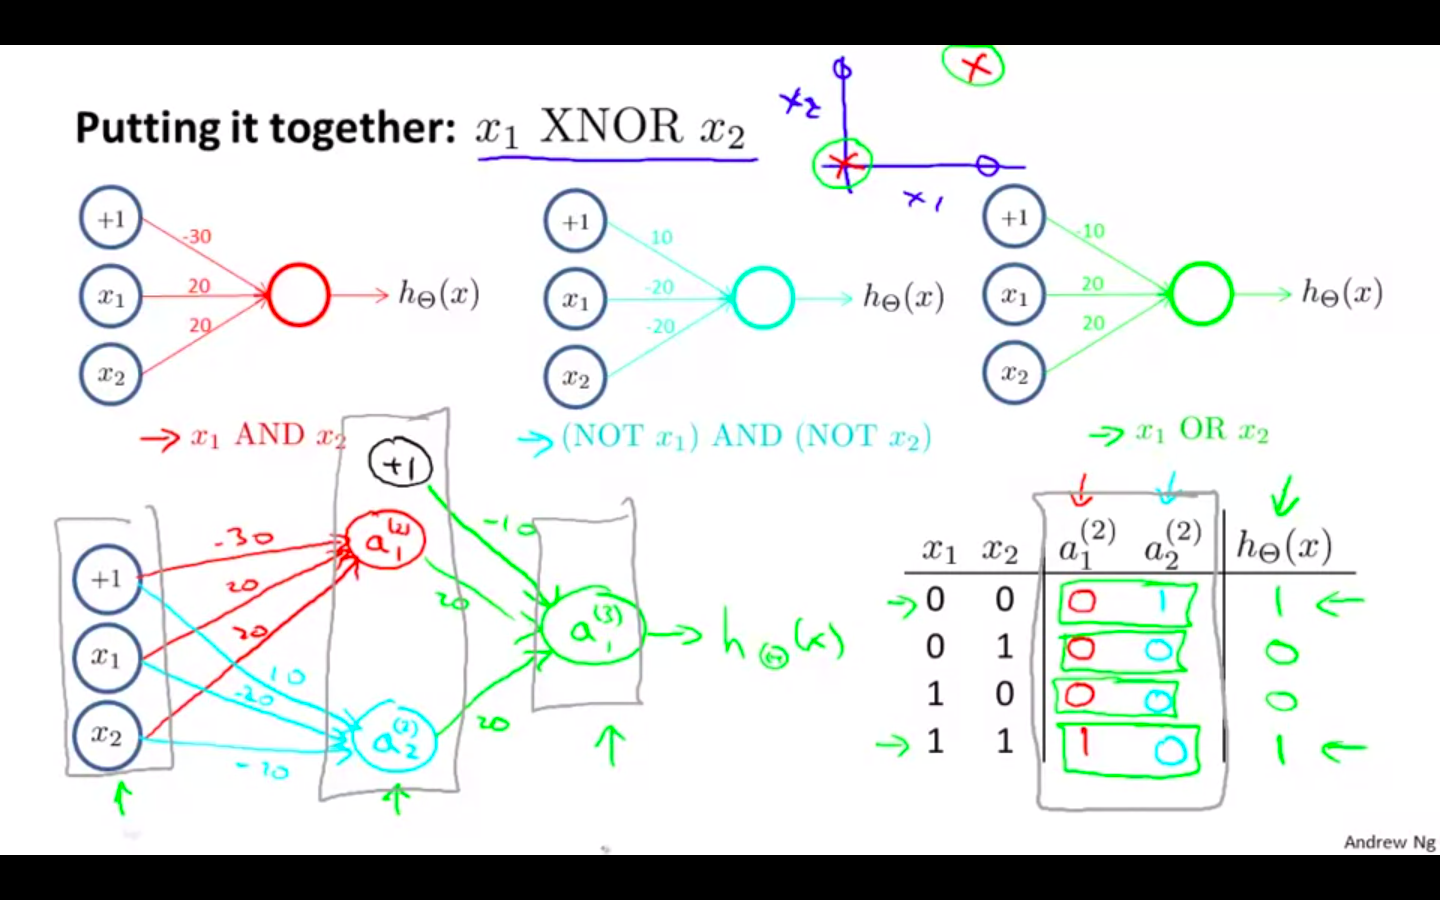
-
Intuition
Multiclass Classification
-
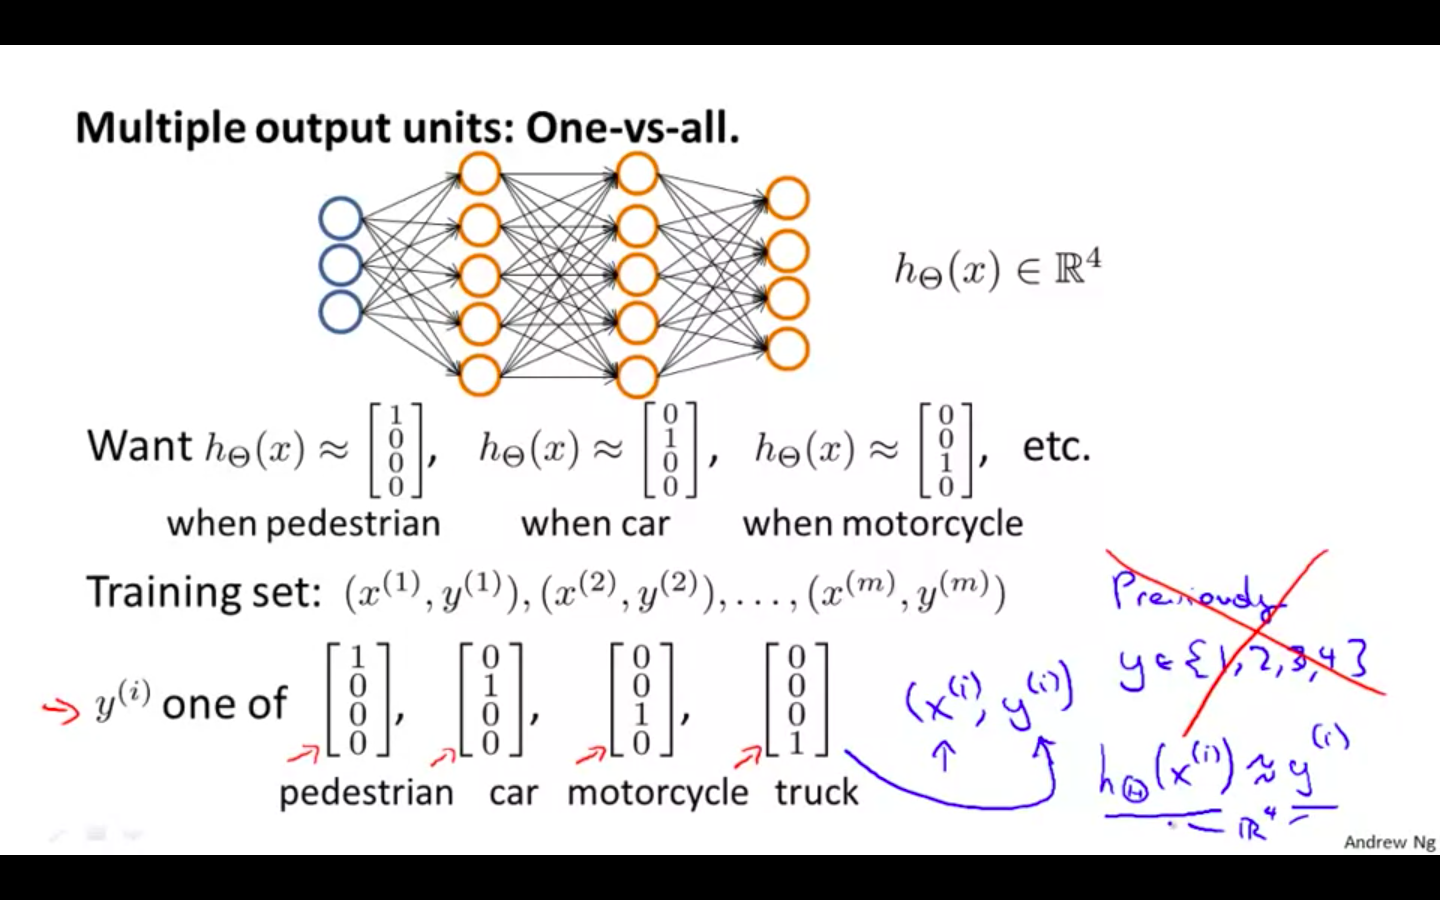
One-vs-All
-
To classify data into multiple classes, we let our hypothesis function return a vector of values.
-
Say we wanted to classify our data into one of four categories. We will use the following example to see how this classification is done.
-
This algorithm takes as input an image and classifies it accordingly:
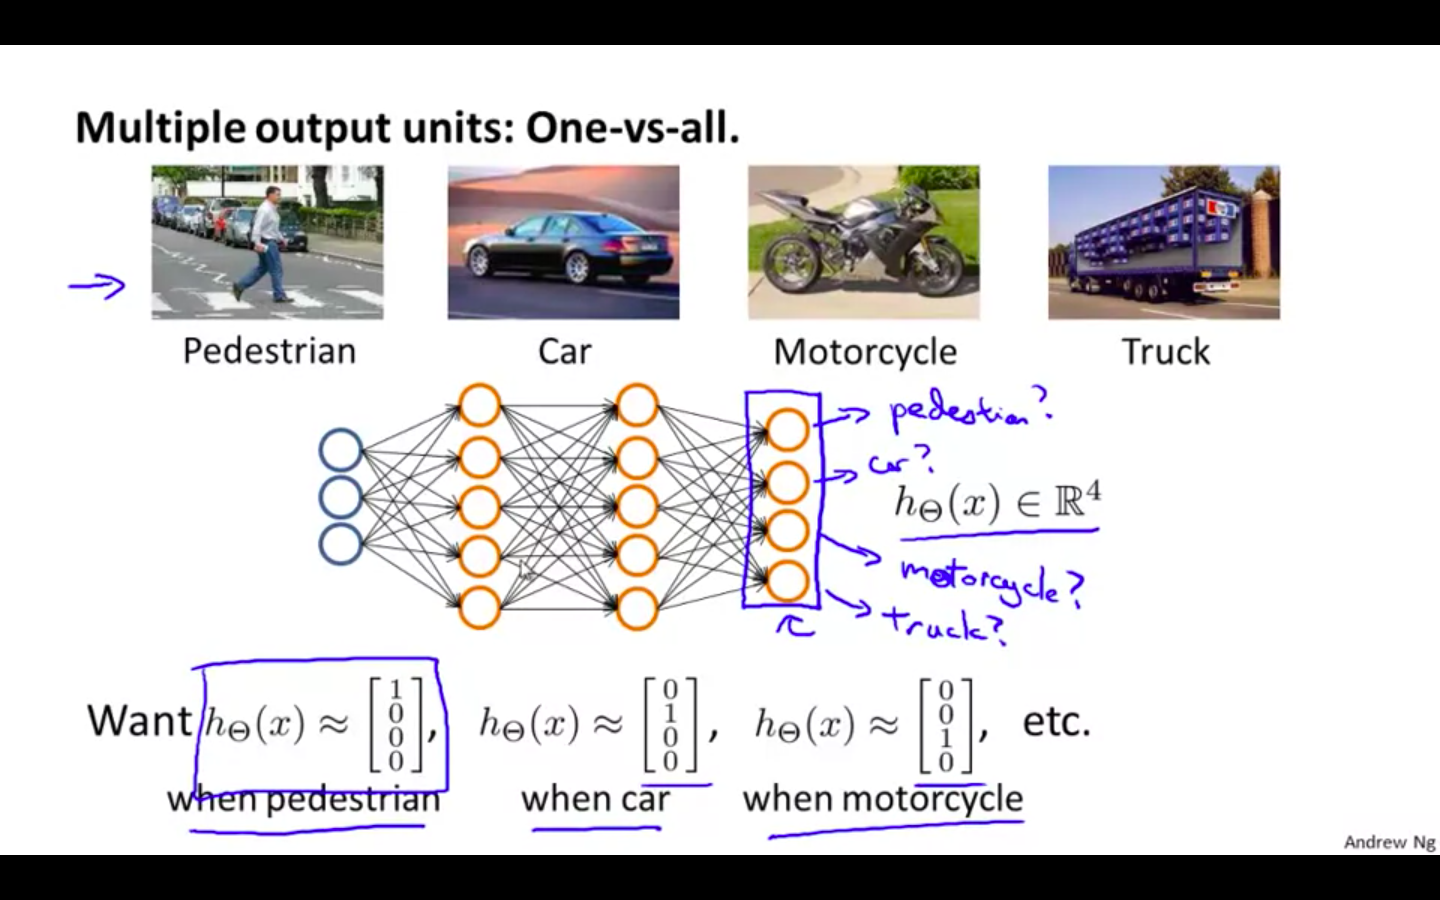
- Our resulting hypothesis for one set of inputs may look like: hΘ(x)=[0010]
-