Machine Learning By Andew Ng - Week 8
Clustering
Unsupervised Learning: Introduction
-
The data in the supervised learning problems comes with labels
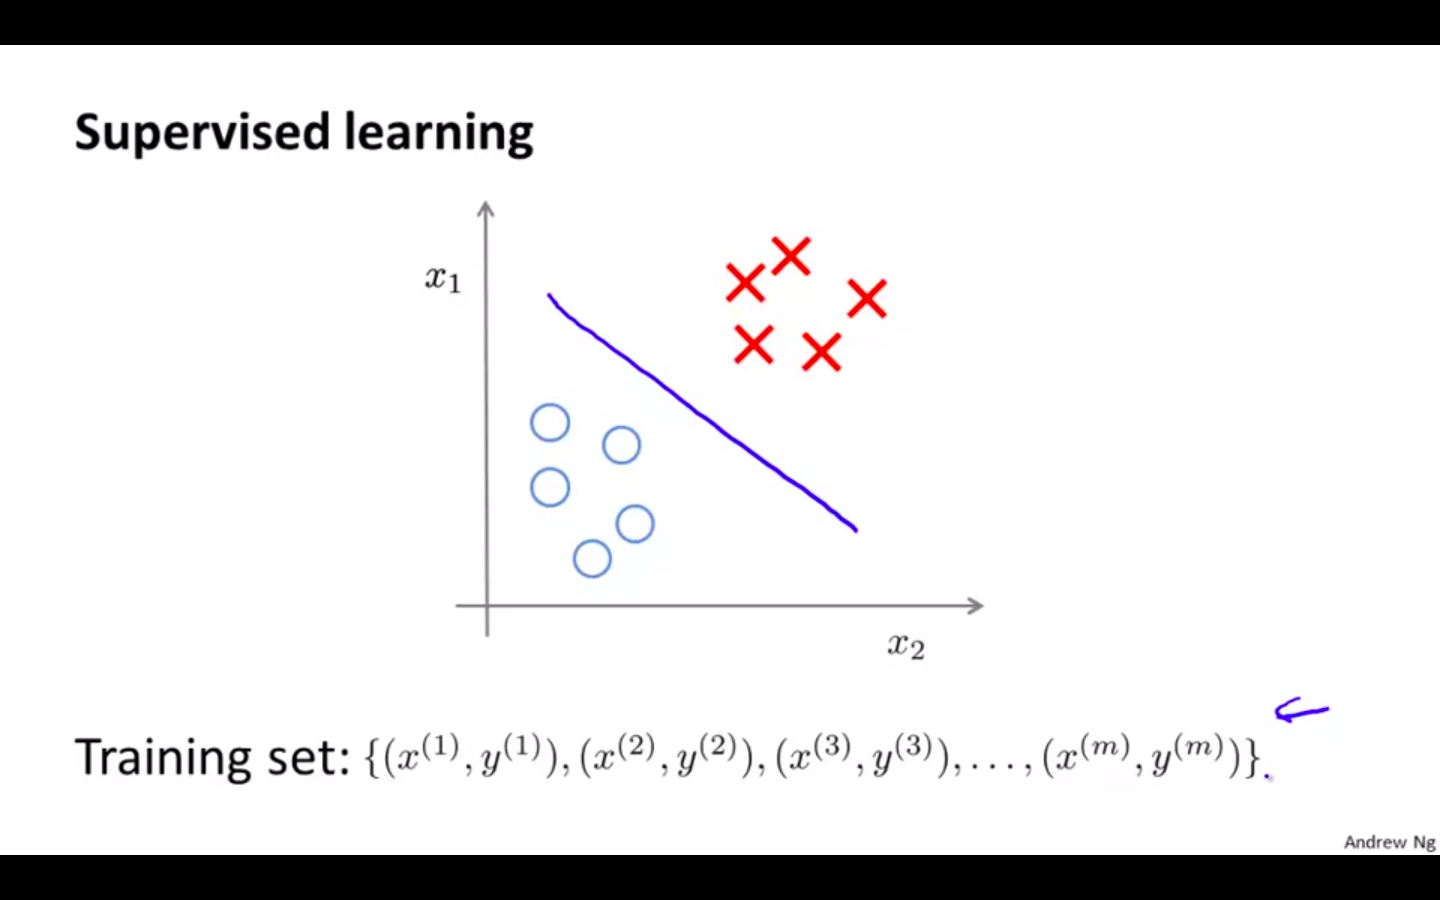
-
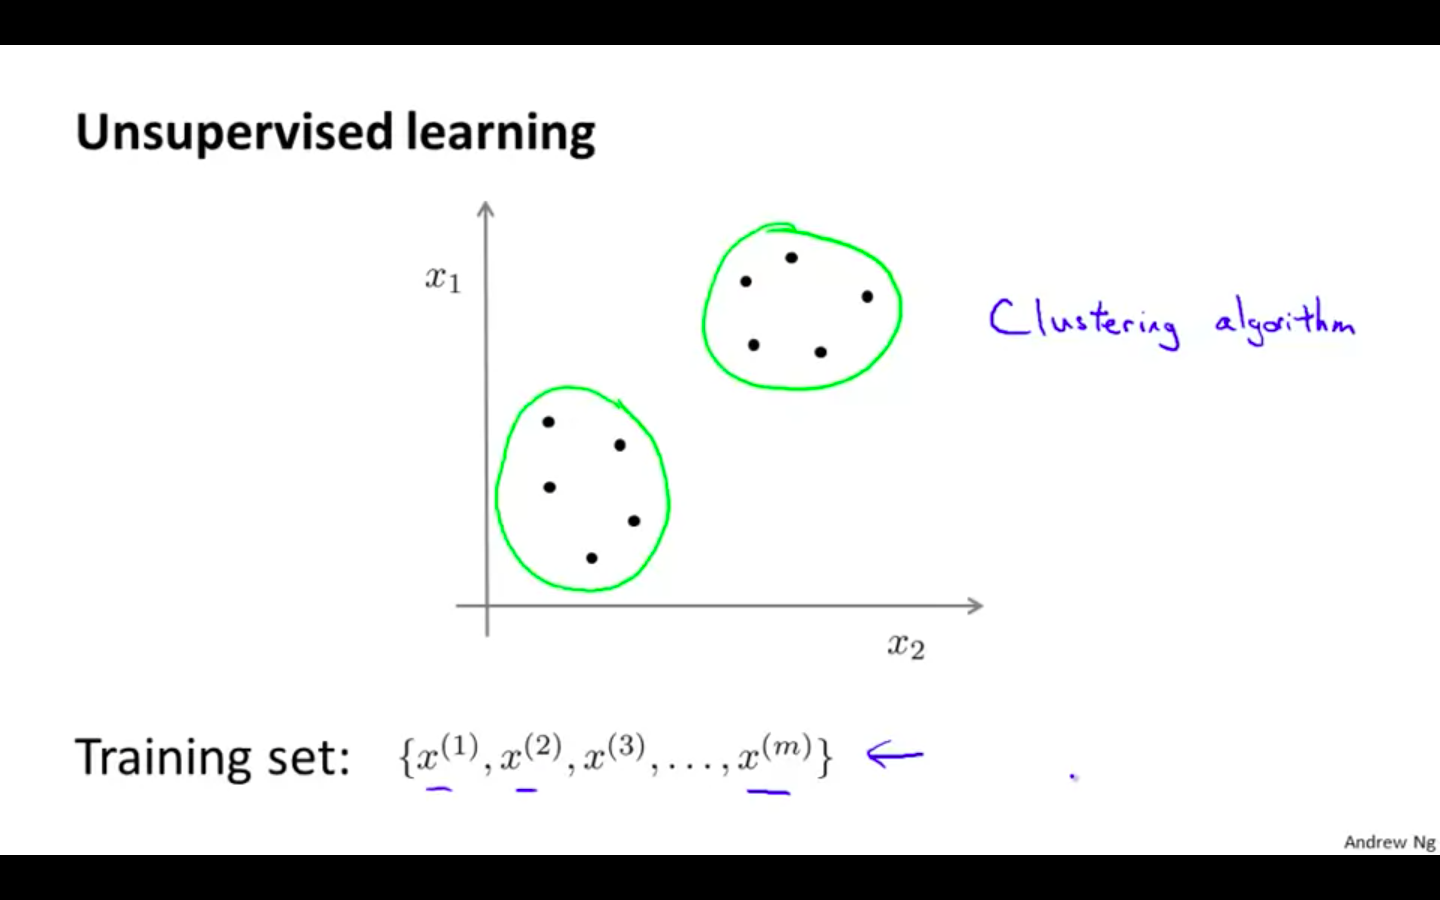
The data in the unsupervised learning problems doesn’t come with the labels
-
Unsupervised learning algorithms are meant to find the structure in the dataset
-
Clustering algorithm is used find groups of data point on the dataset
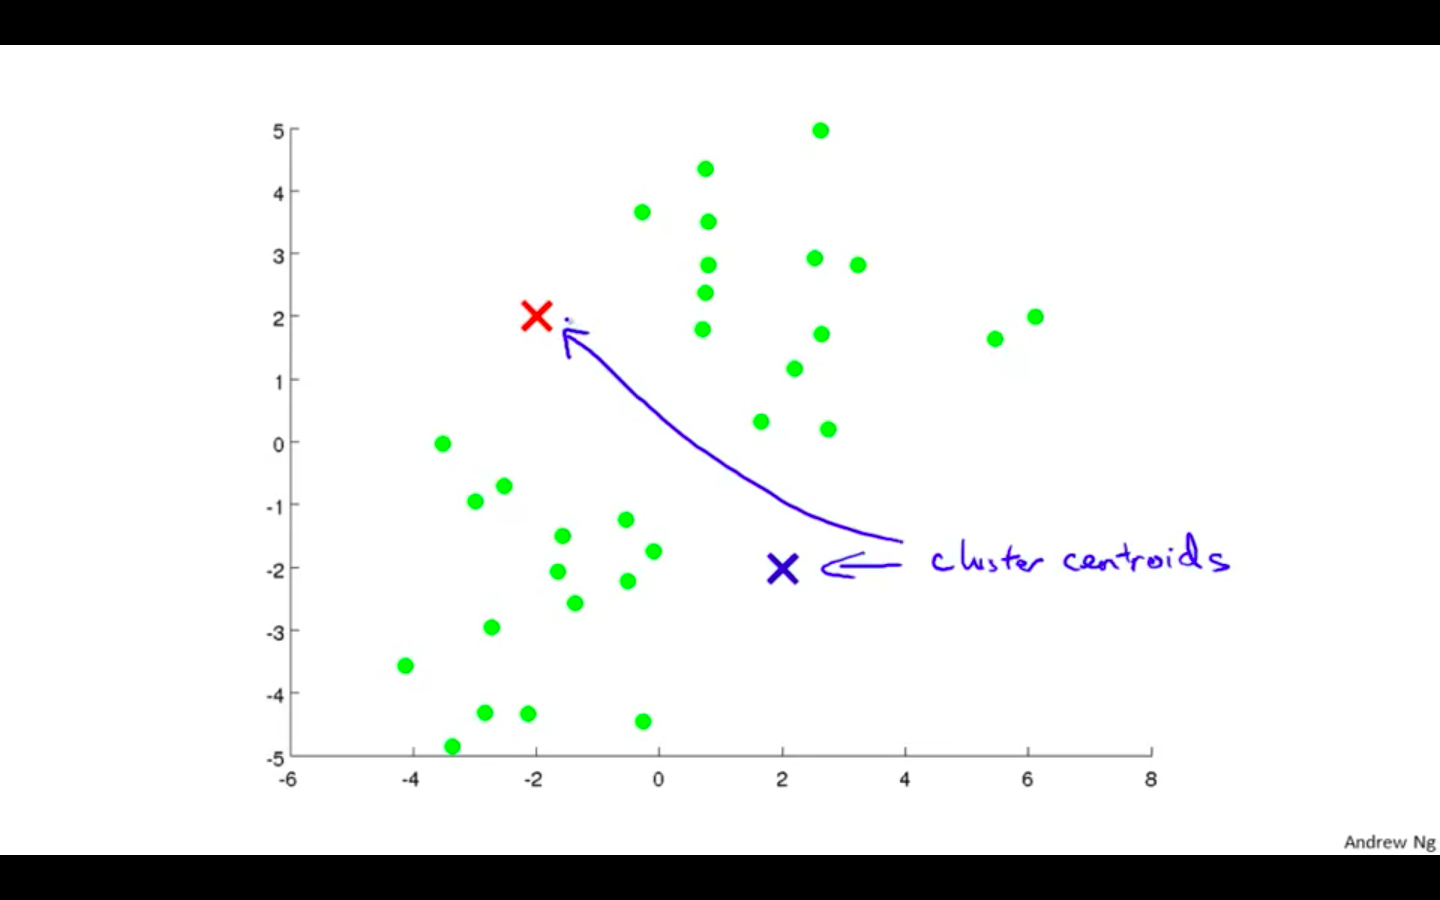
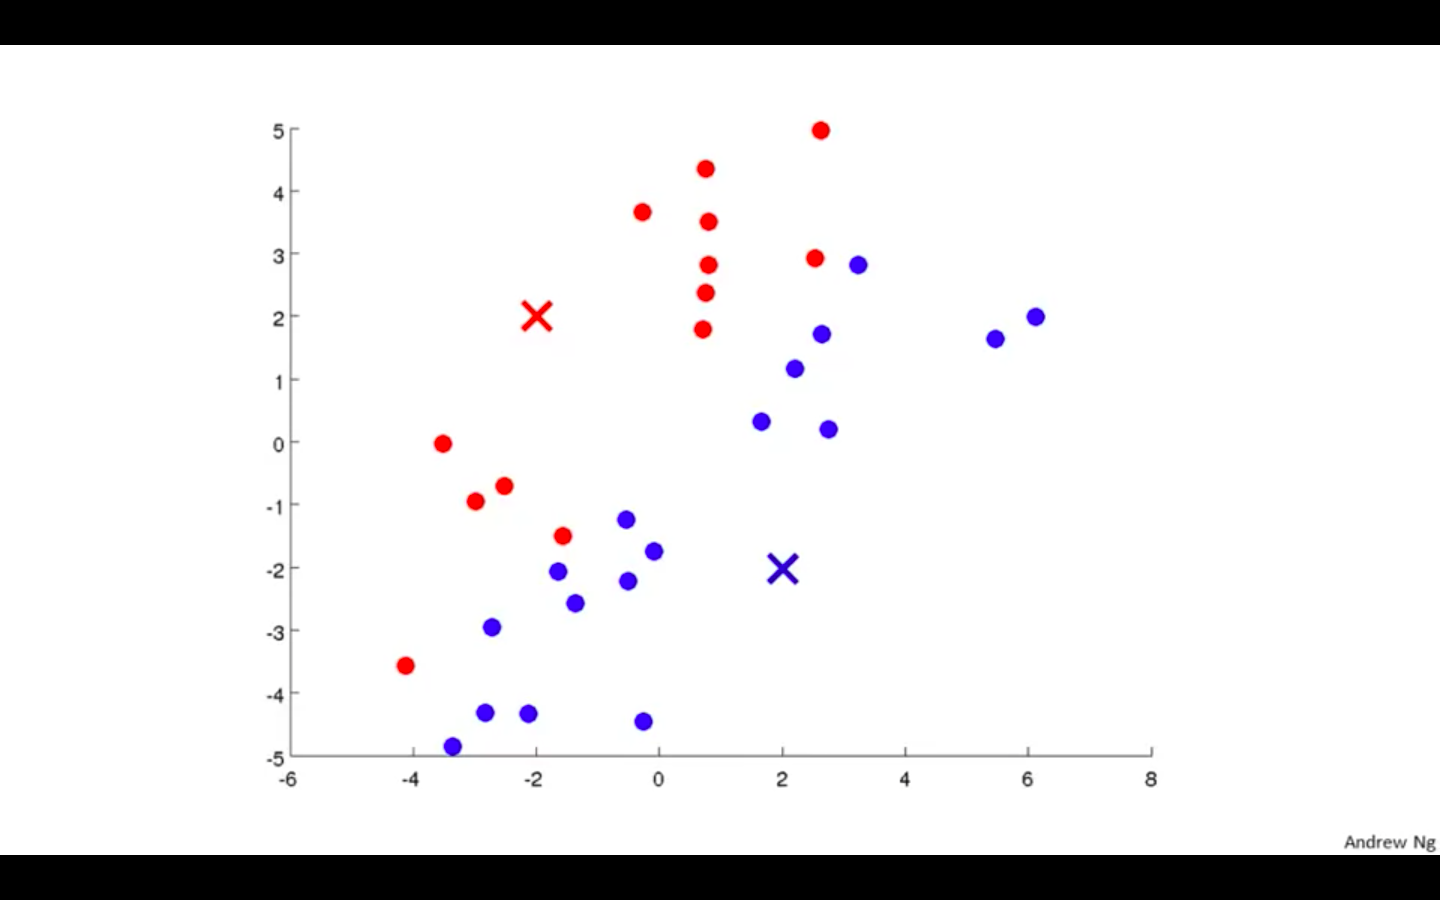
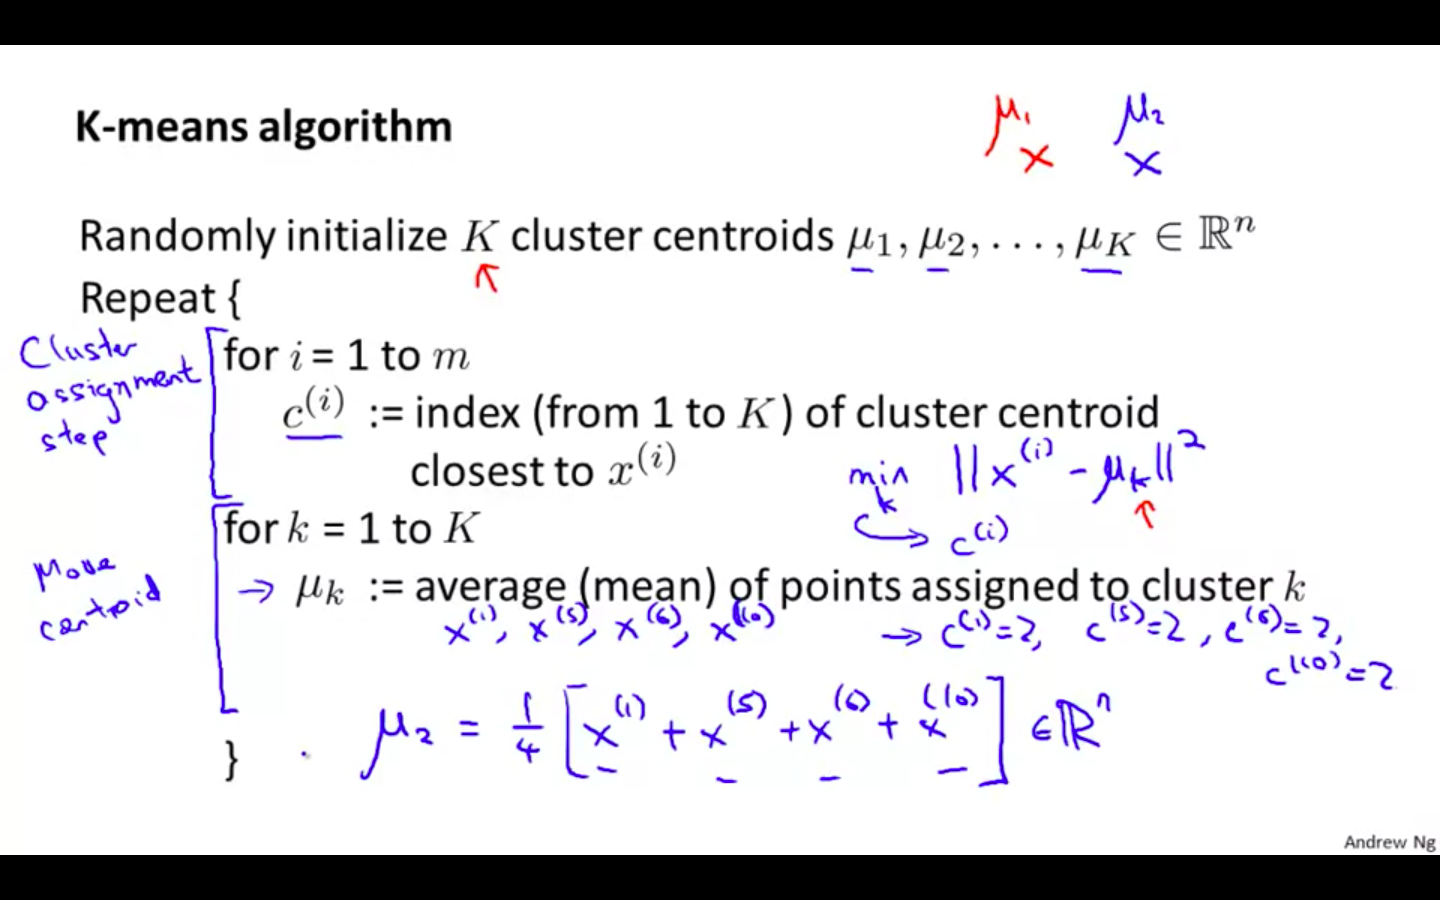
K-Means Algorithm
-
This is a Clustering Algorithm
-
Steps
-
Cluster Centroids
-
Random Initialisation
-
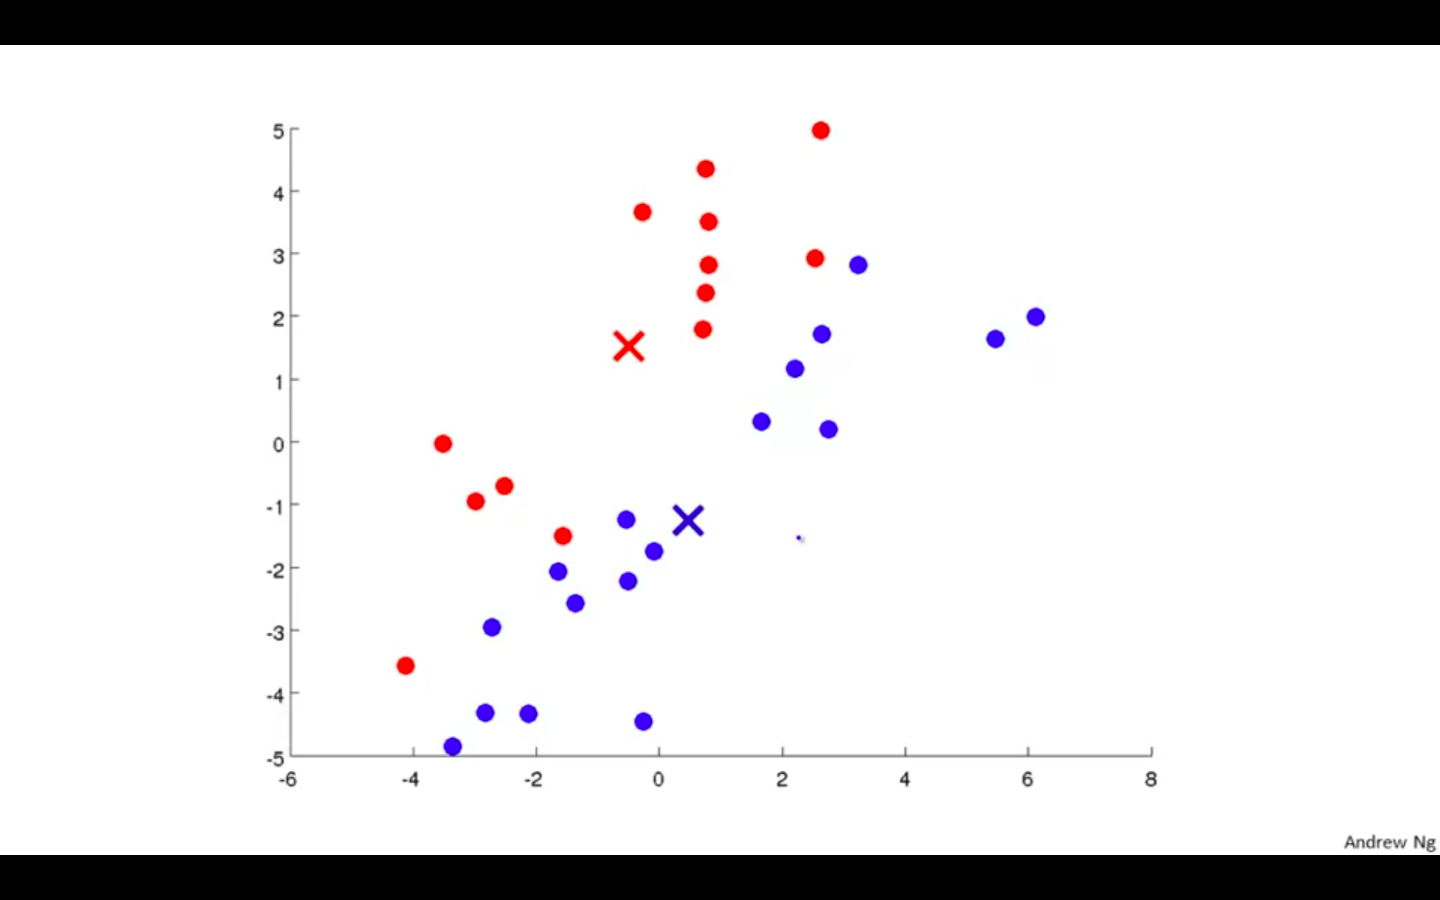
Mark a new cluster according to the points nearer to the centroids
-
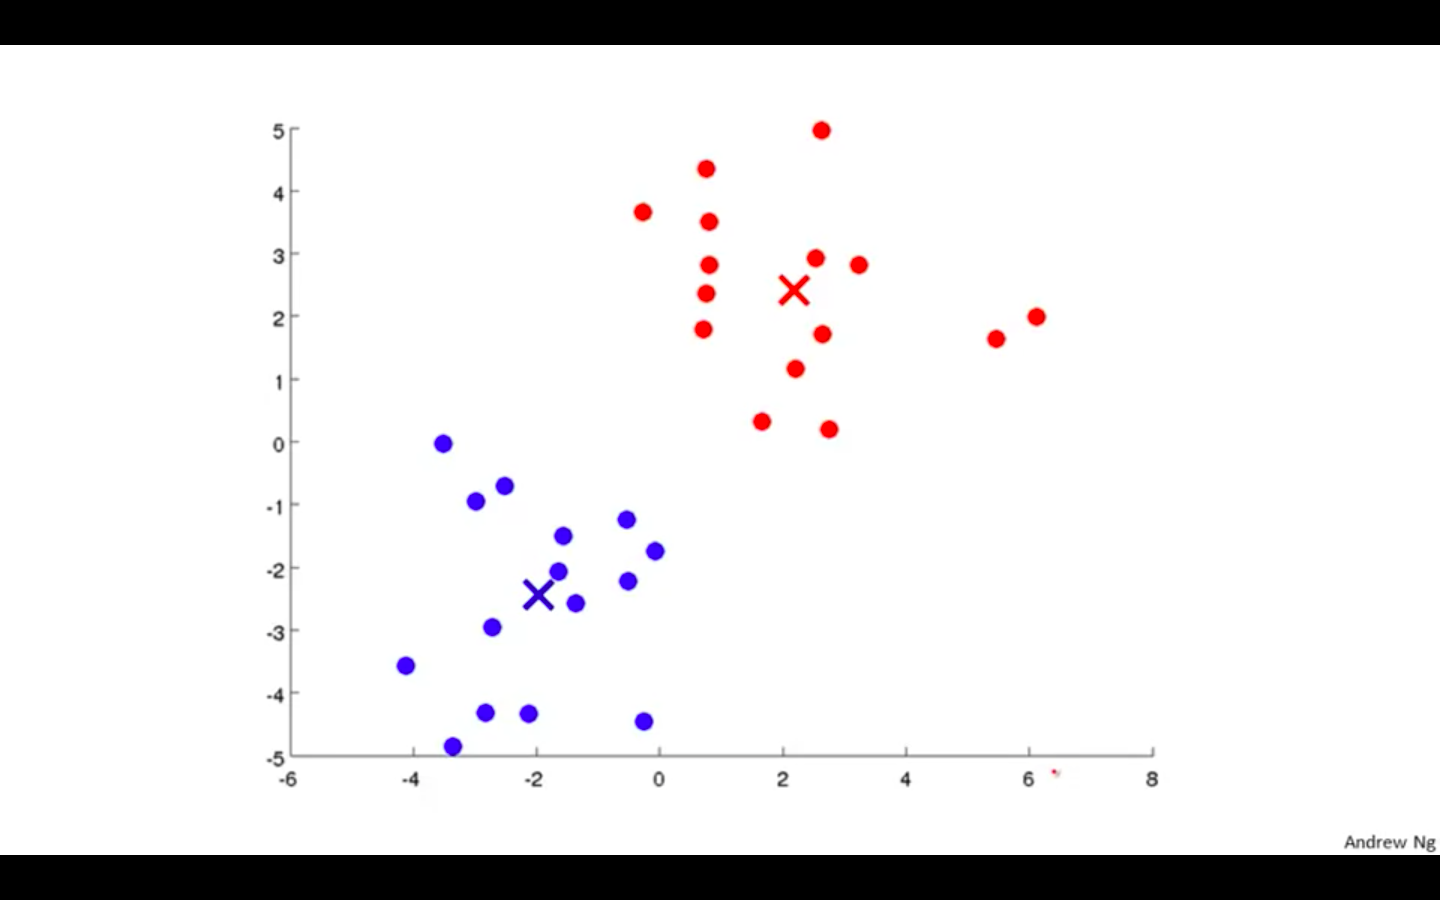
Move Centroids to the average of new cluster
-
Repeat until the centroid doesn’t change
-
-
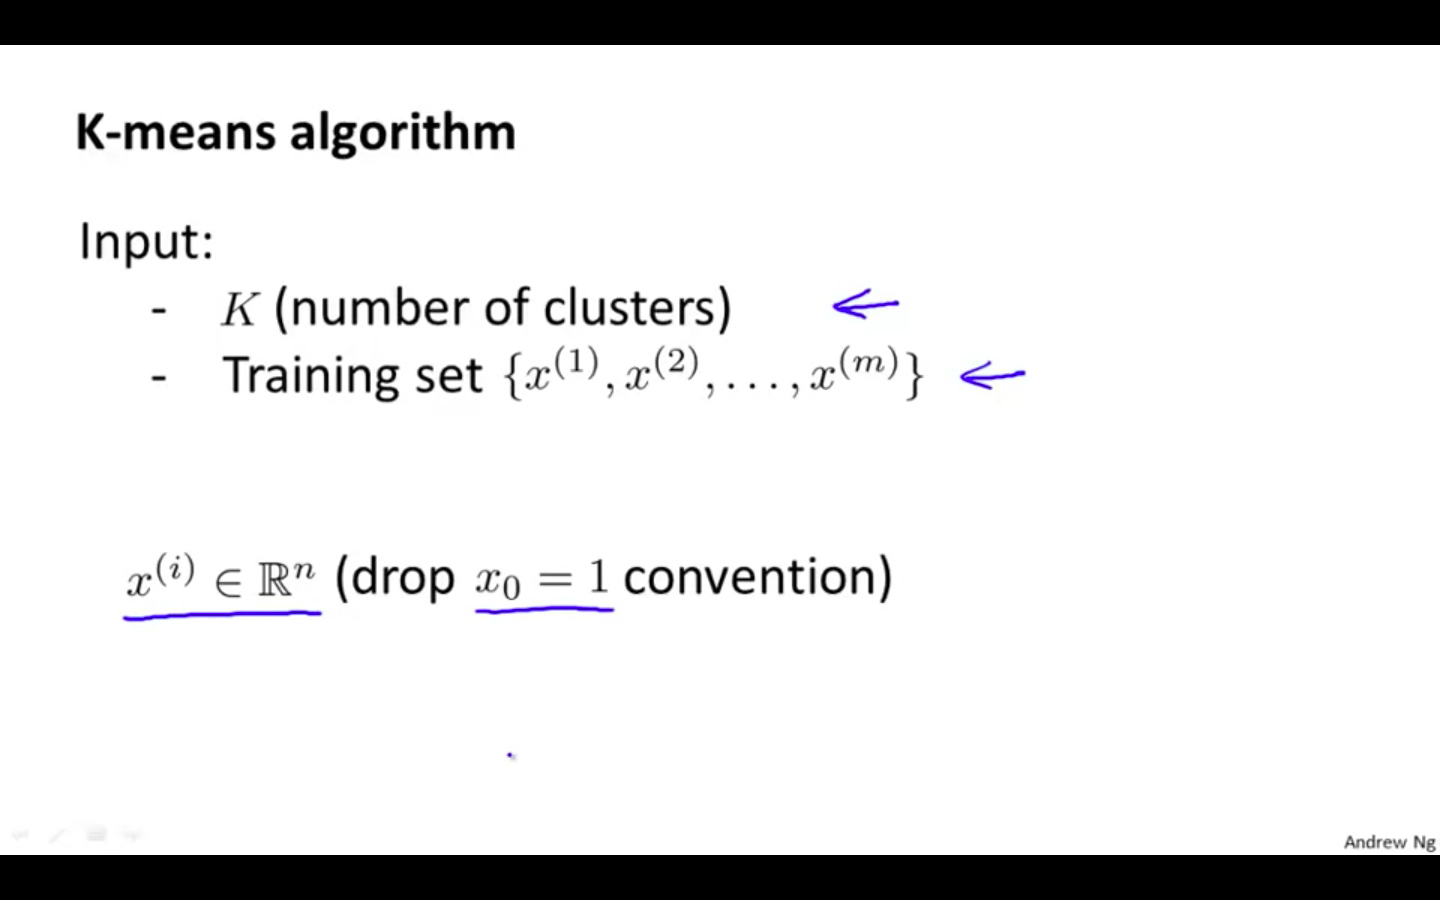
K-Means Algorithm
-
Input
-
K - number of clusters
-
Training Set
-
-
Overview Steps
-
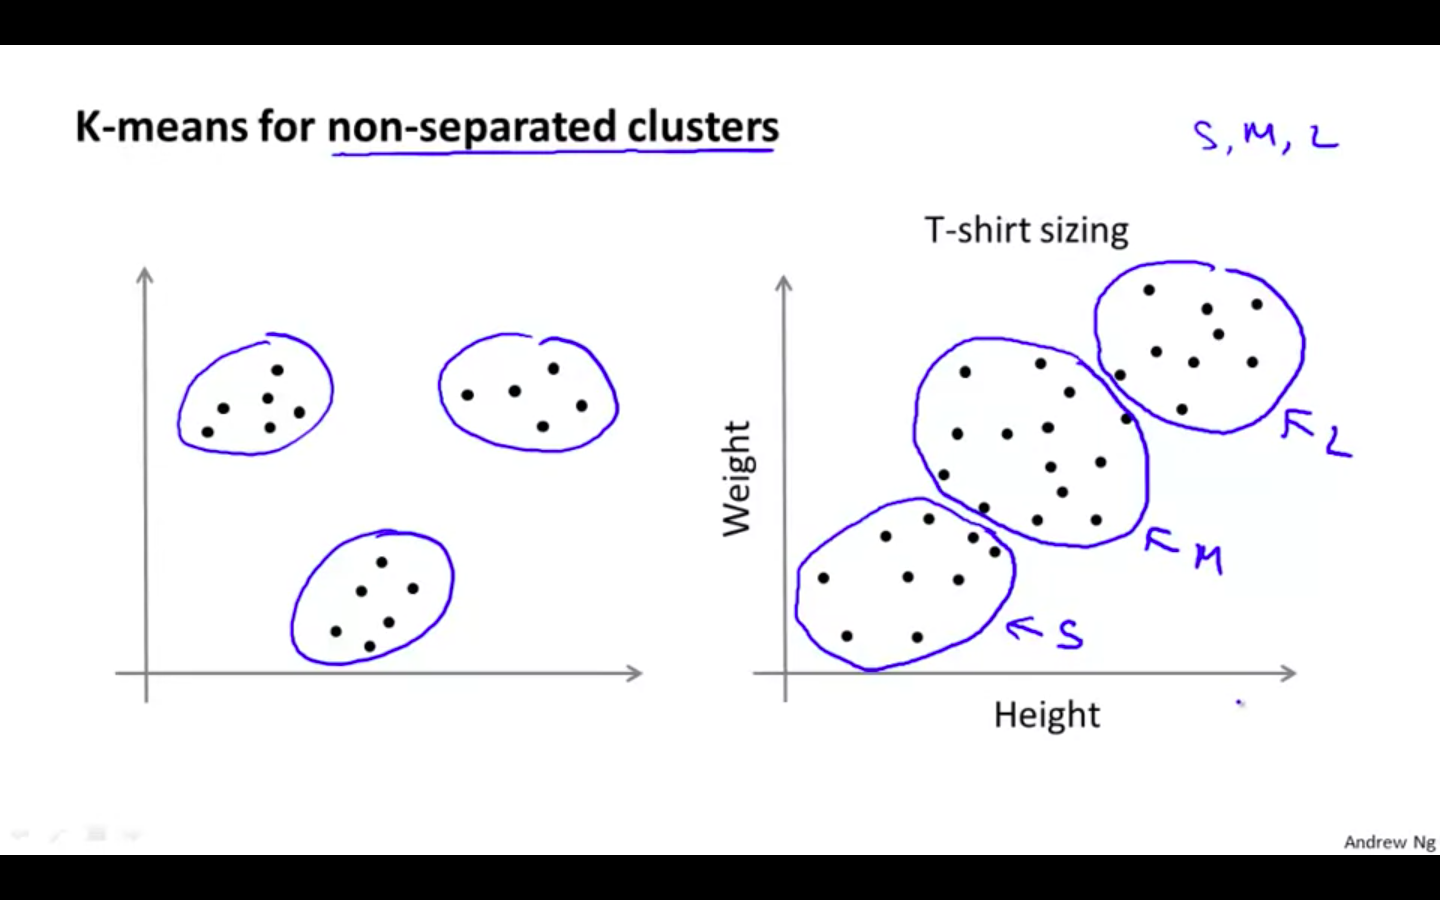
For Non-Separated Data
-
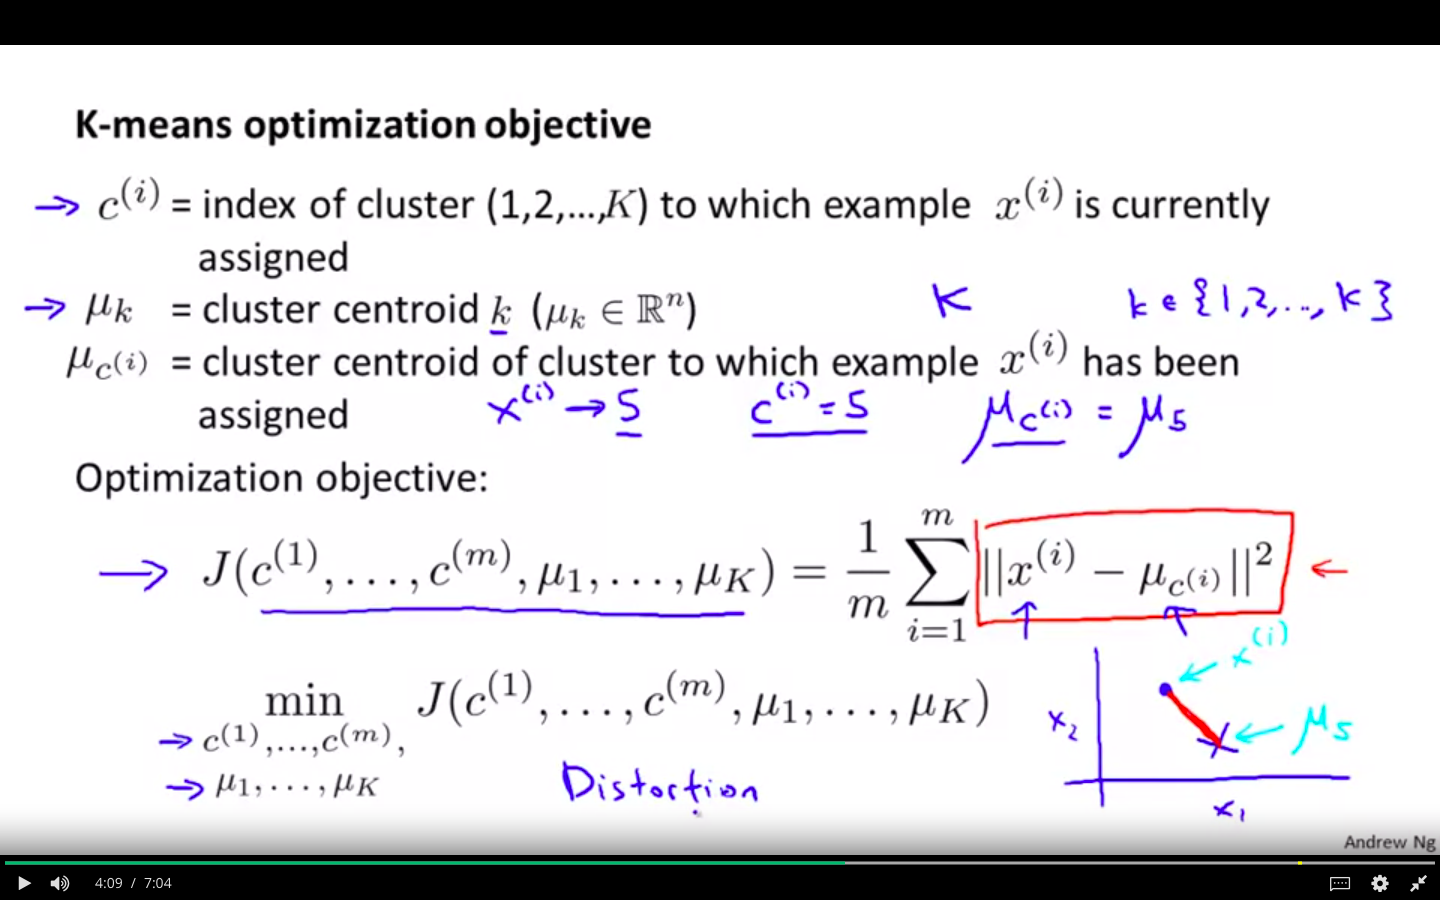
Optimisation Objective
-
Optimisation Objective
- Minimise the distance between the actual point and the centroid of the cluster associated
-
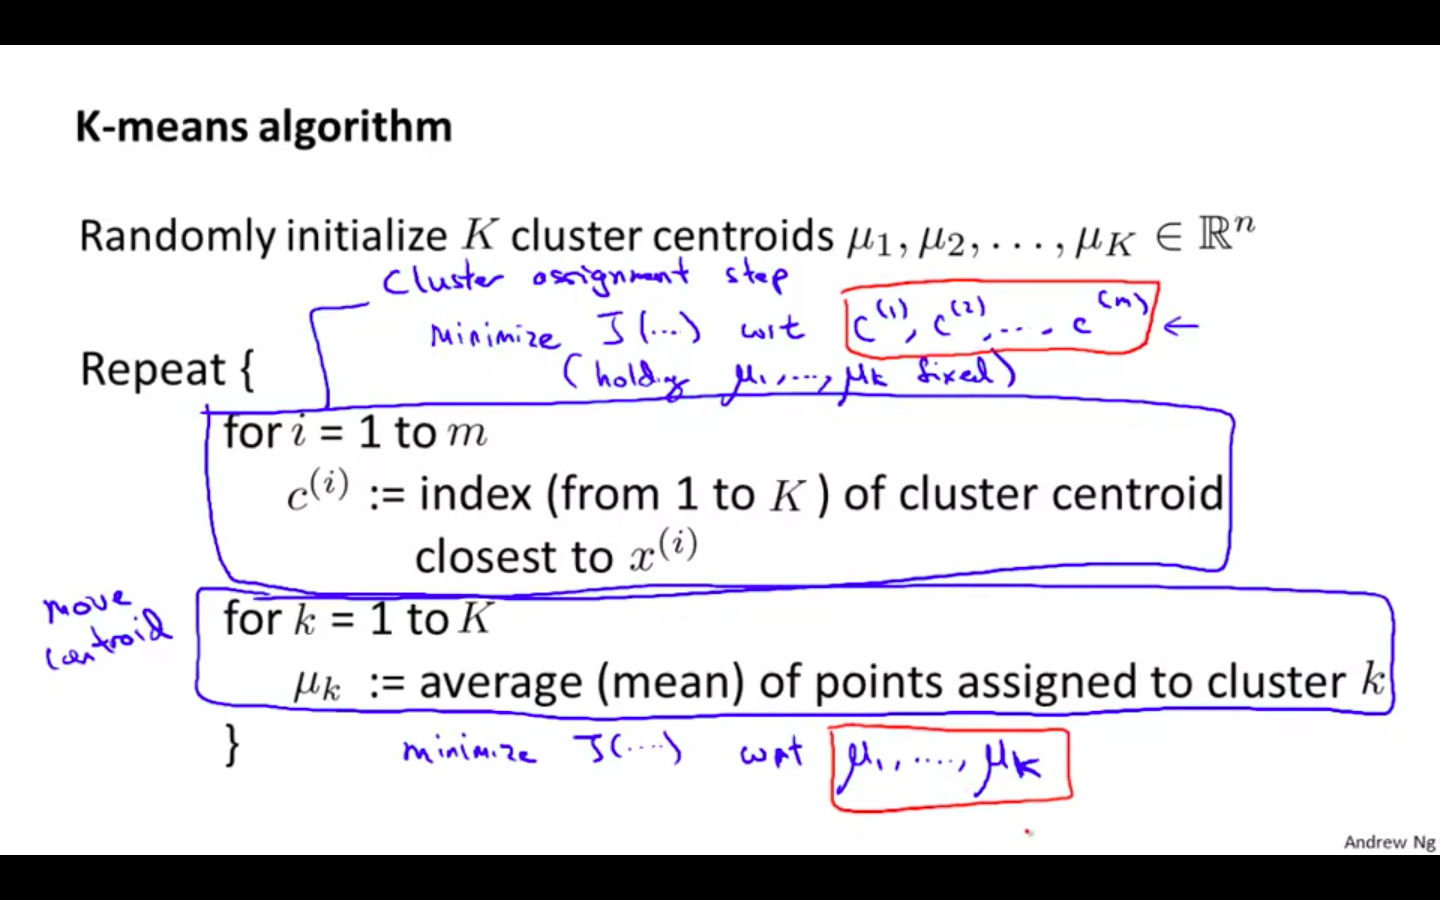
Algorithm
-
First part of the algorithm consist of minimising cost function with respect to c^i holding u_k fixed
-
Second part of the algorithm consist of minimising cost function with respect to u_k
-
Random Initialisation
-
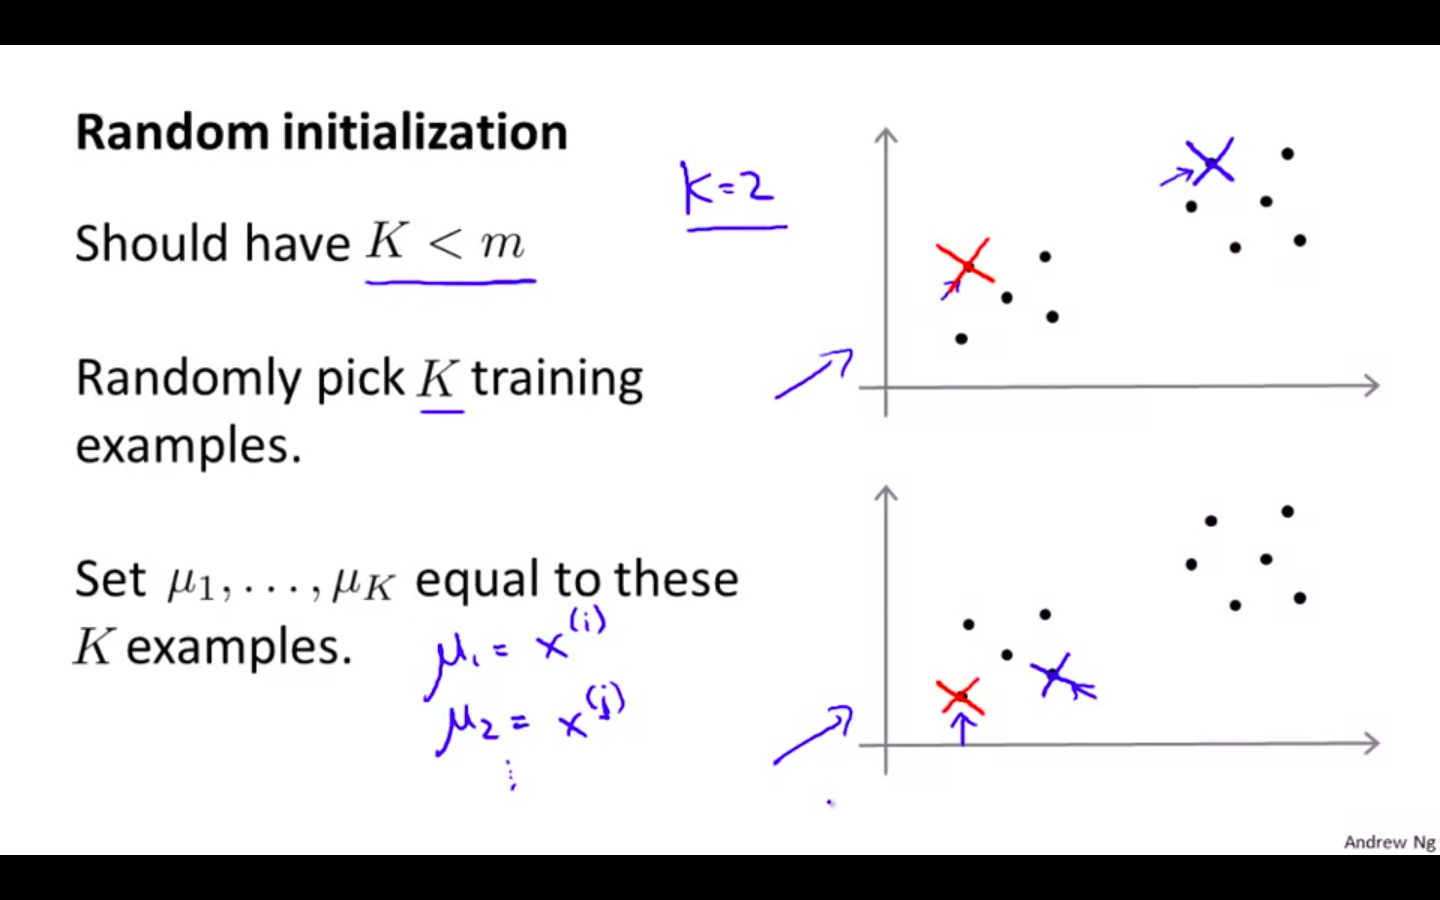
Random Initialisation
- Should have K < m
- Randomly pick K training examples
- Set u_1….u_k to these K examples
-
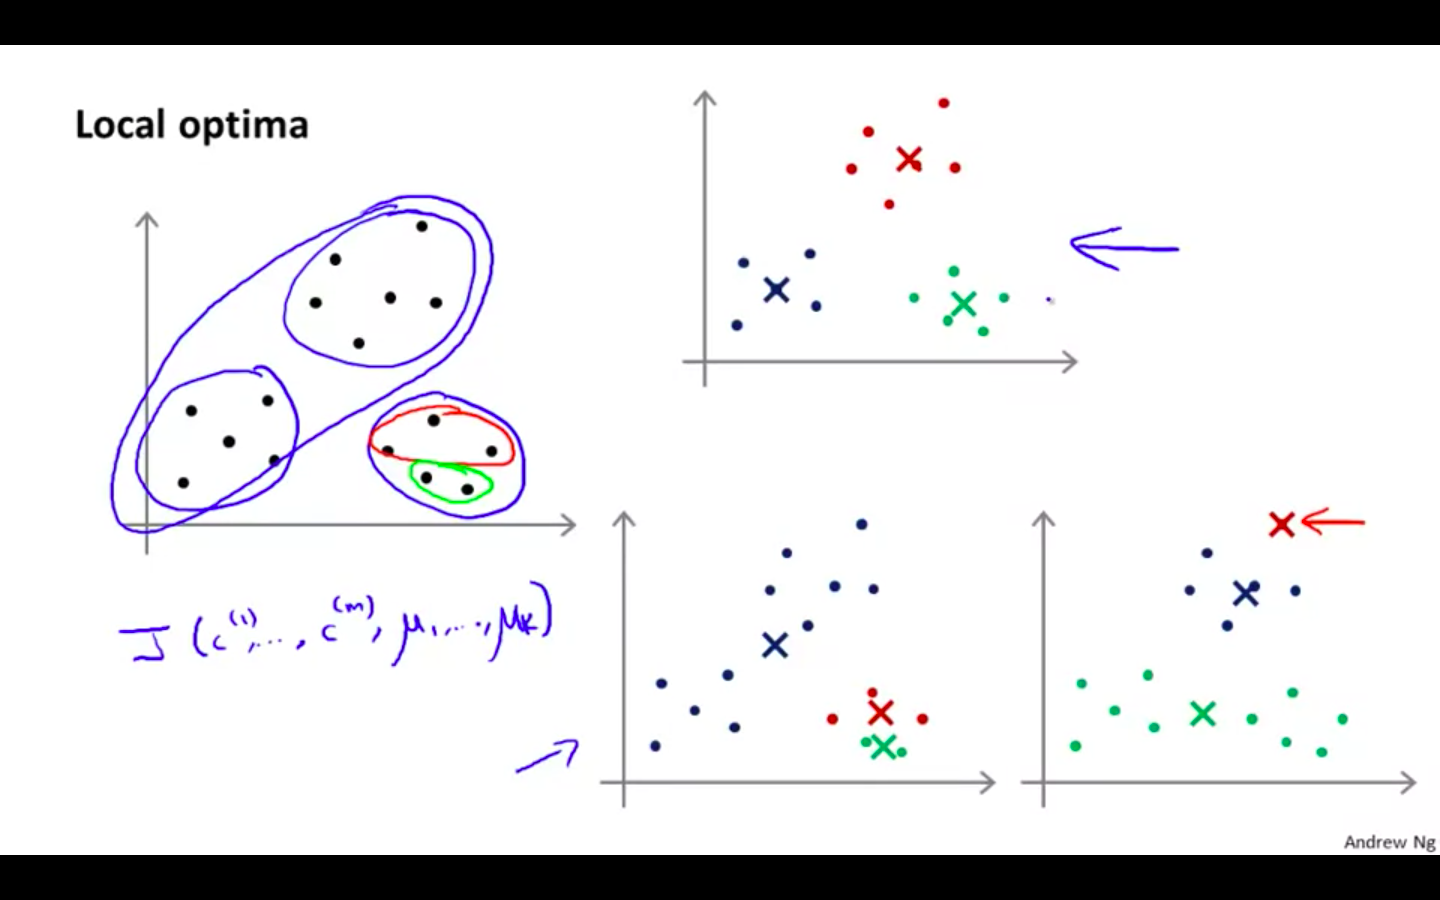
Local Optima
- K-Means can get stuck at local optima
-
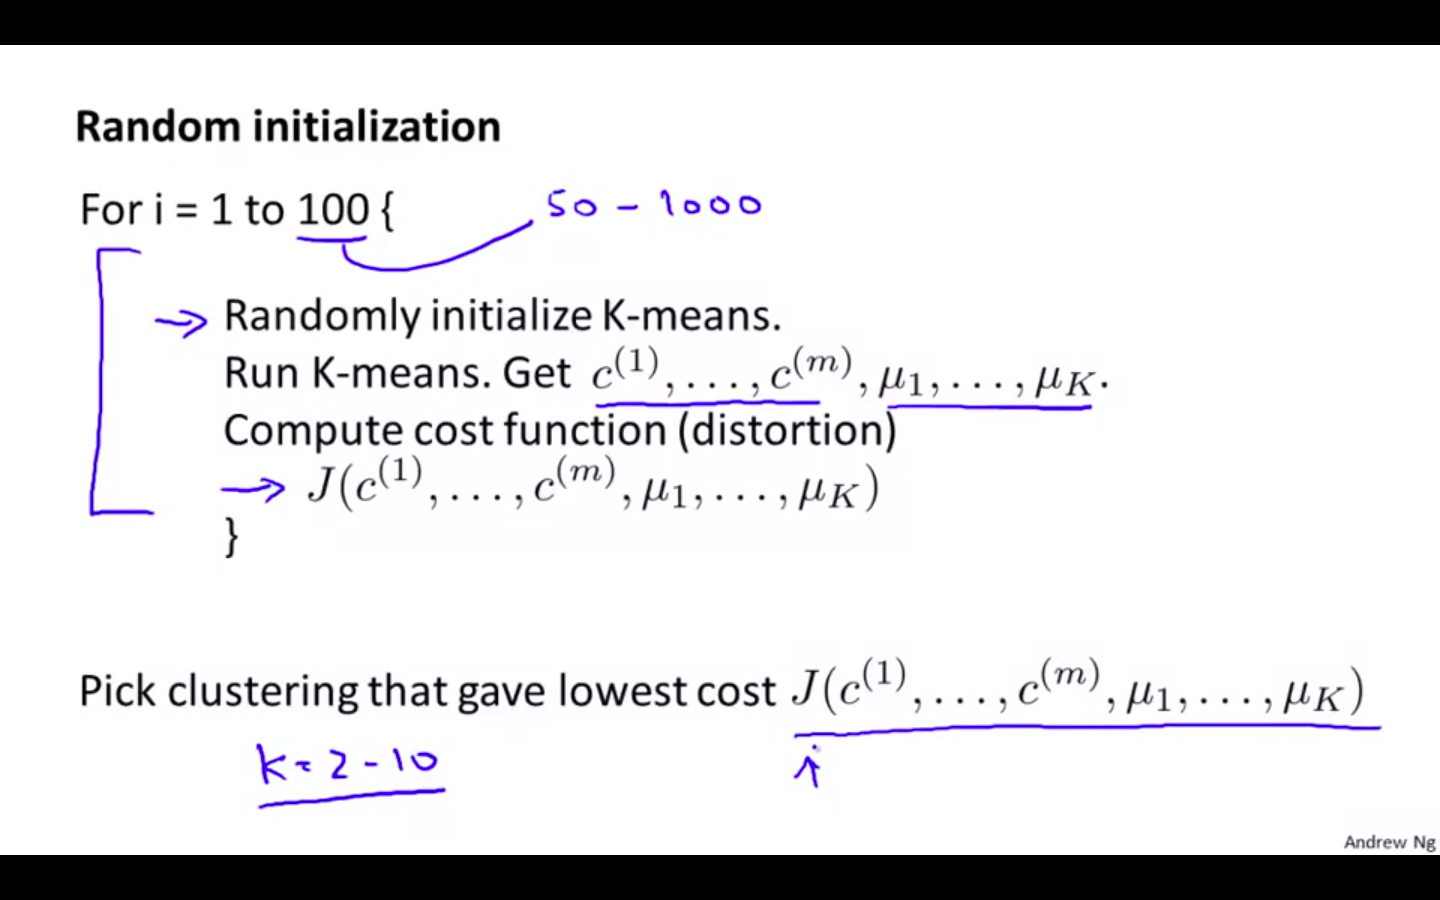
Random Initialisation Extended
-
Run K-Means for n number of times
- n = 50 to 1000
-
Pick the iteration which gives the minimum cost function
-
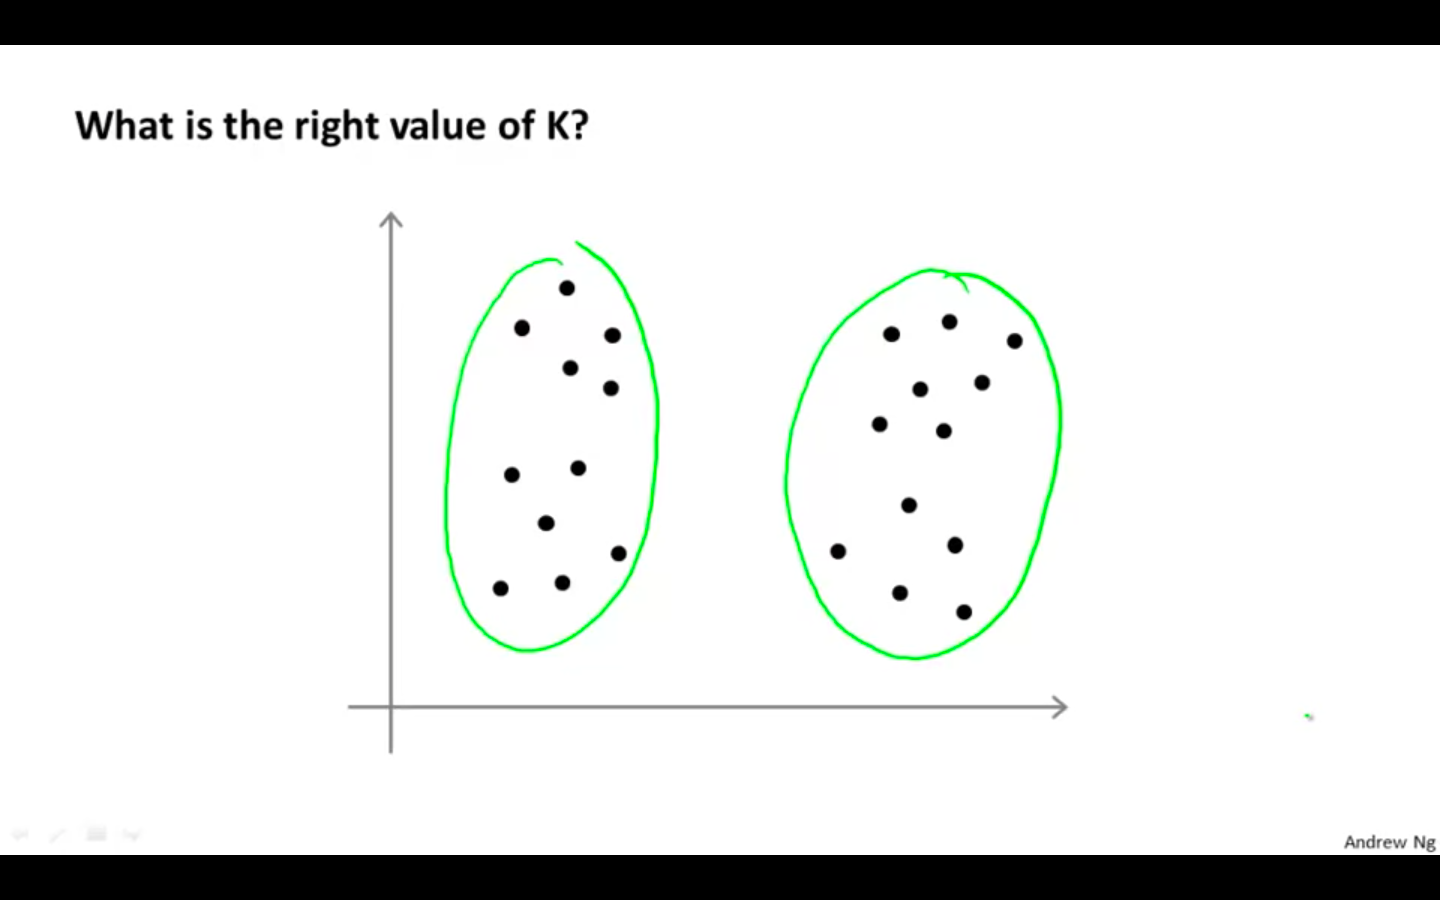
Choosing the Number of Clusters
-
What is the right value of K ?
-
Elbow Method
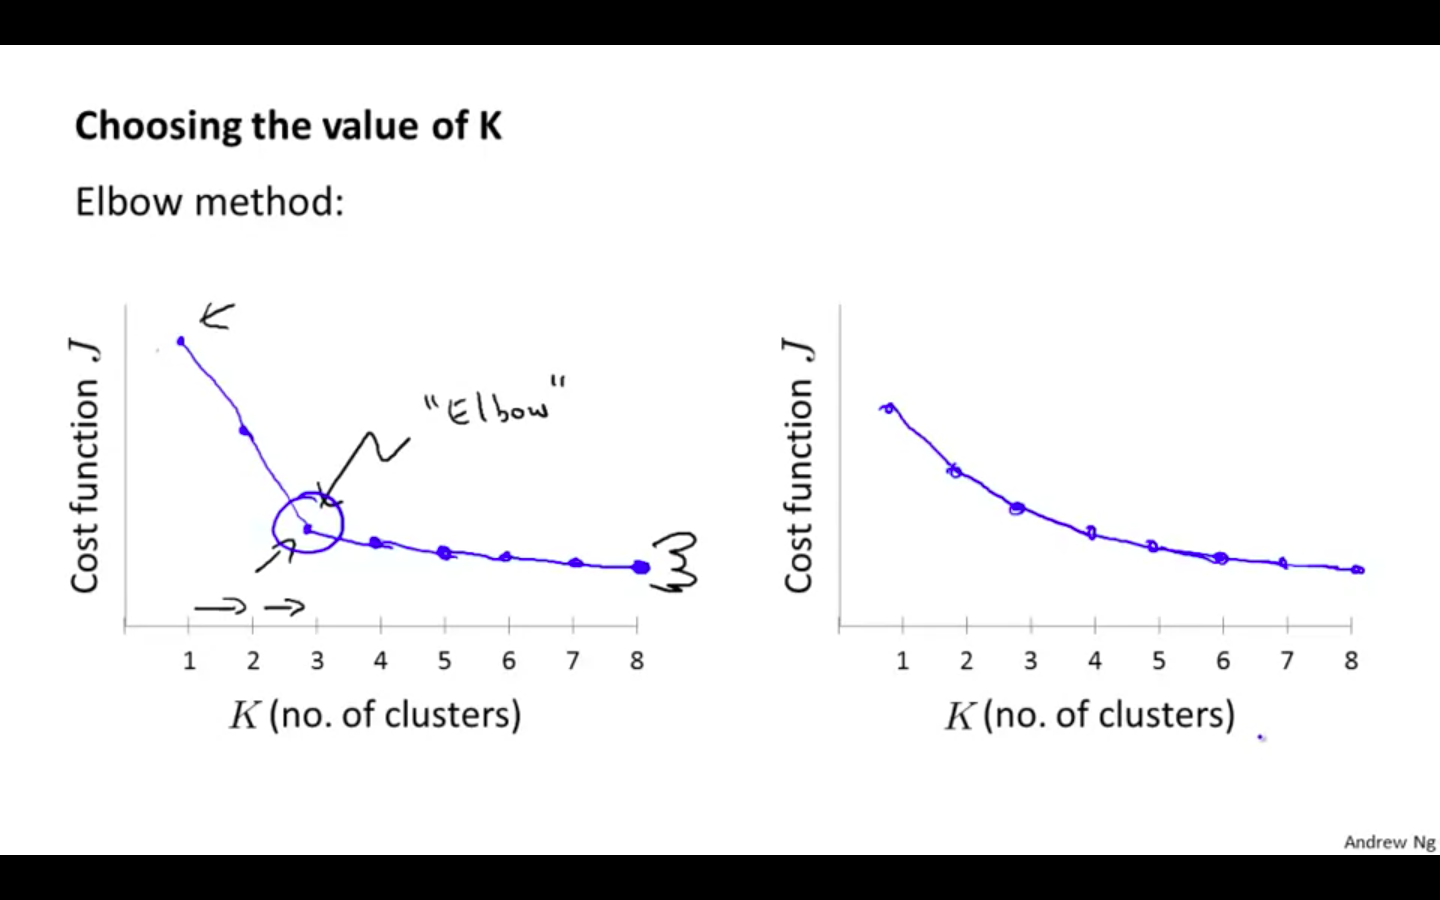
-
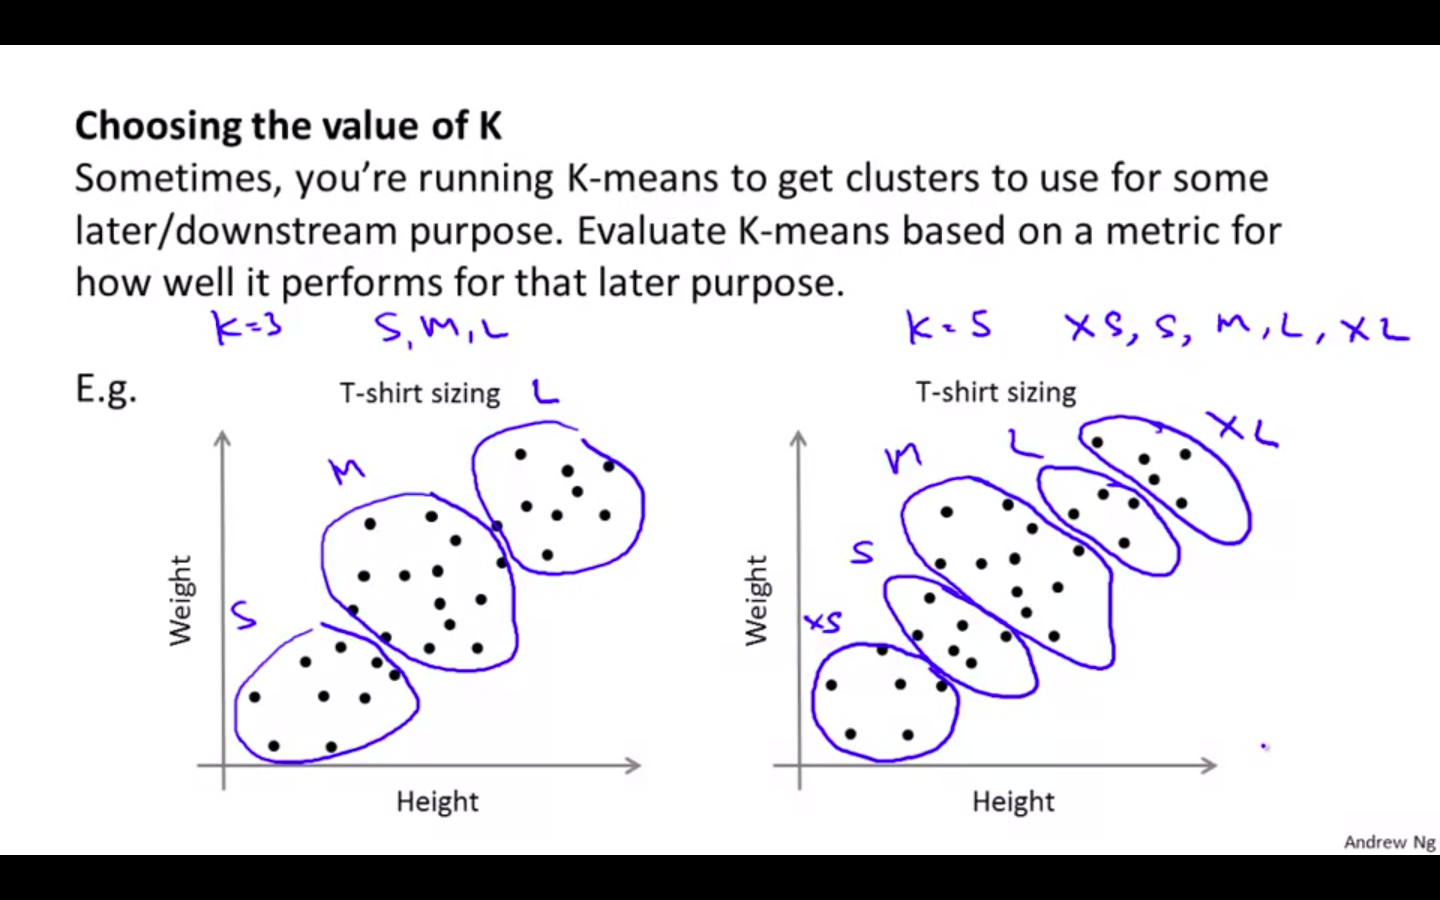
Other Method
- Choosing the value of K based on the application
Motivation
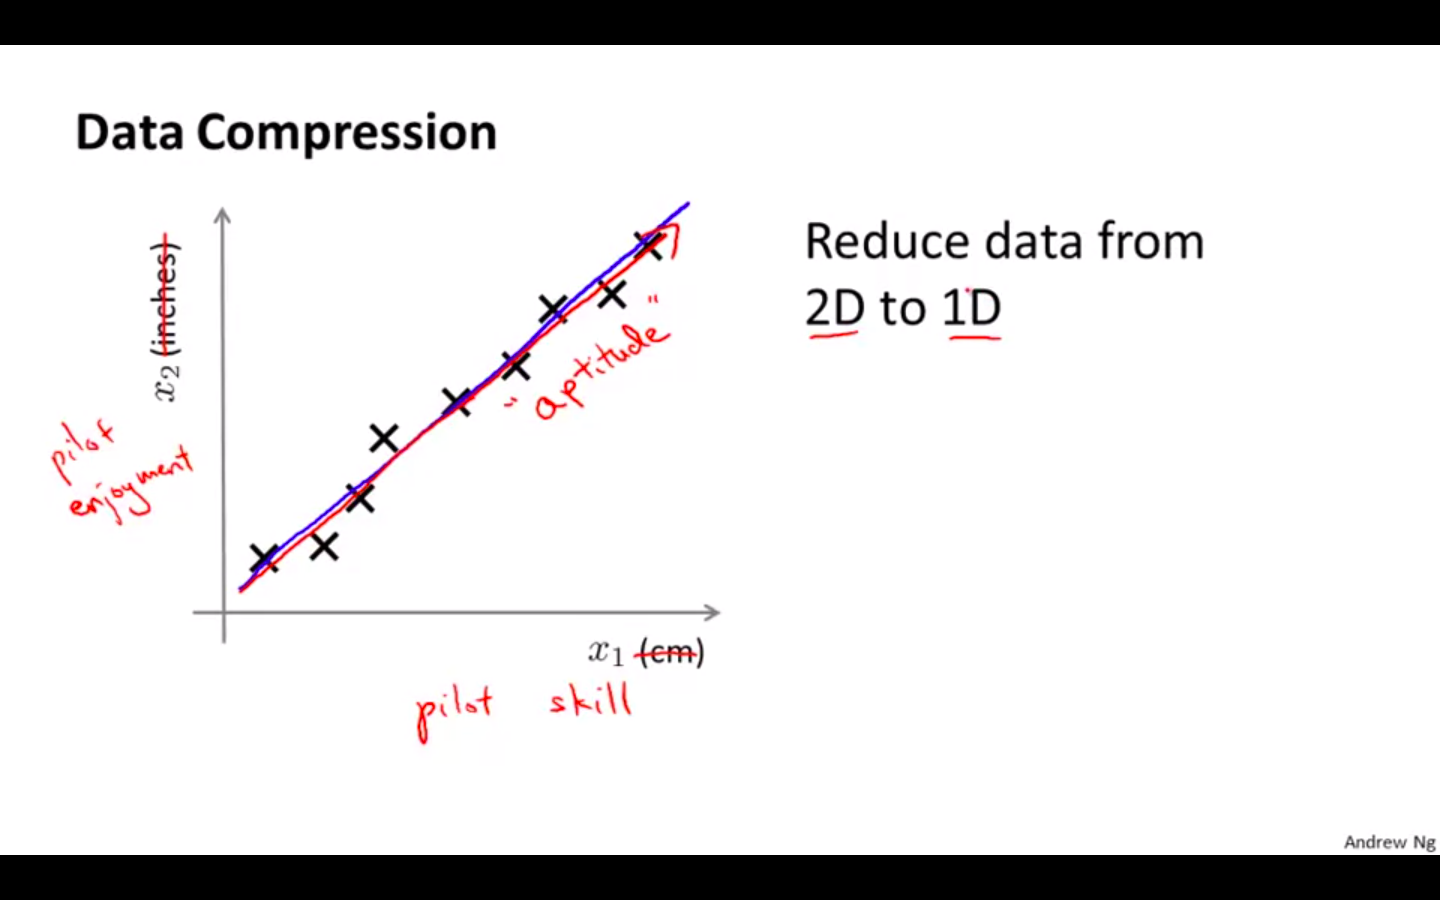
Motivation 1: Data Compression
-
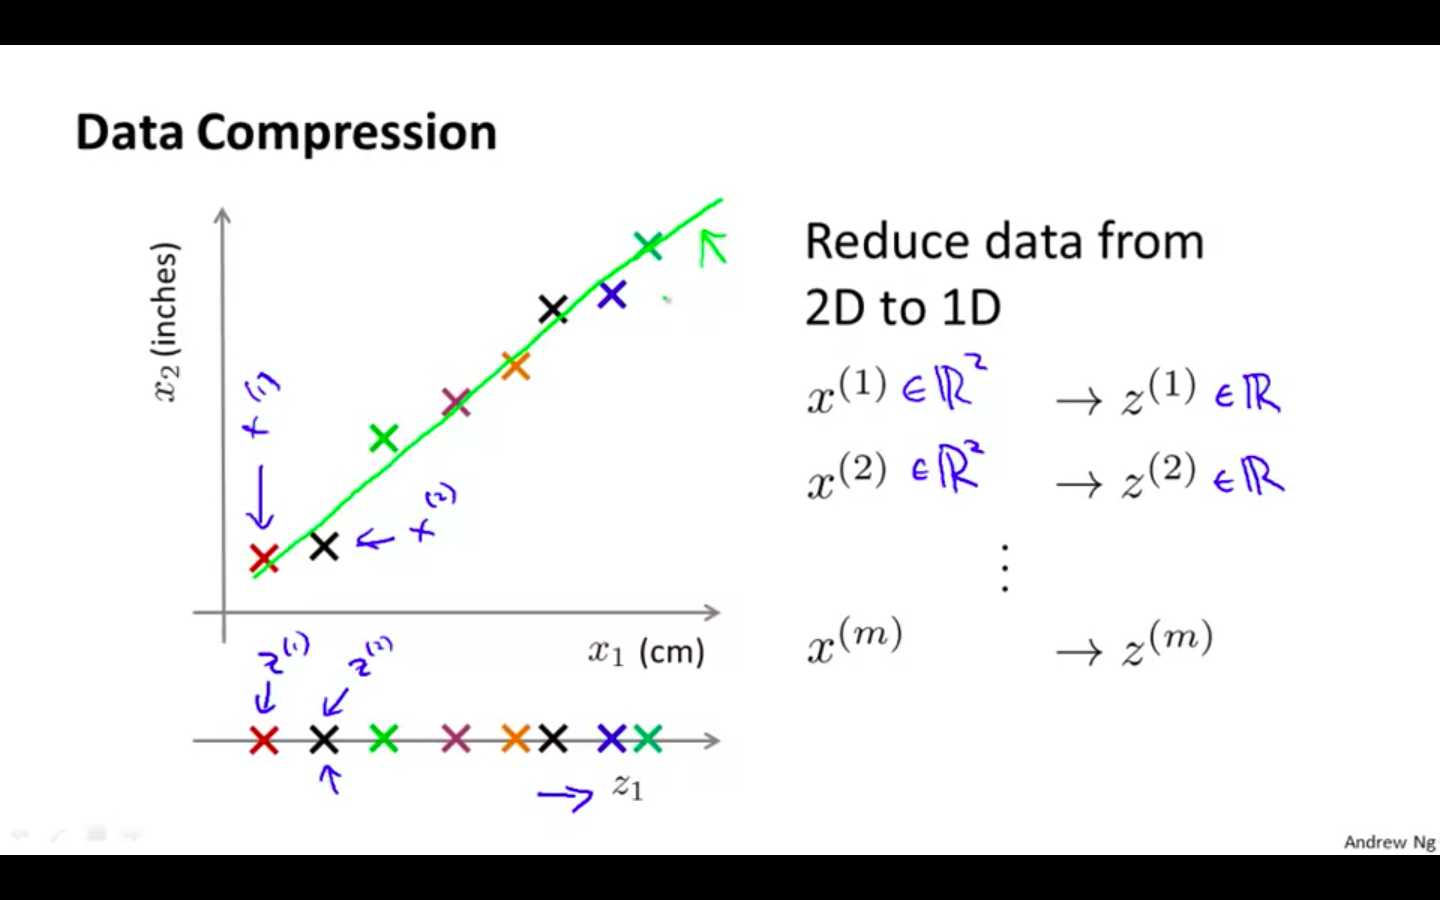
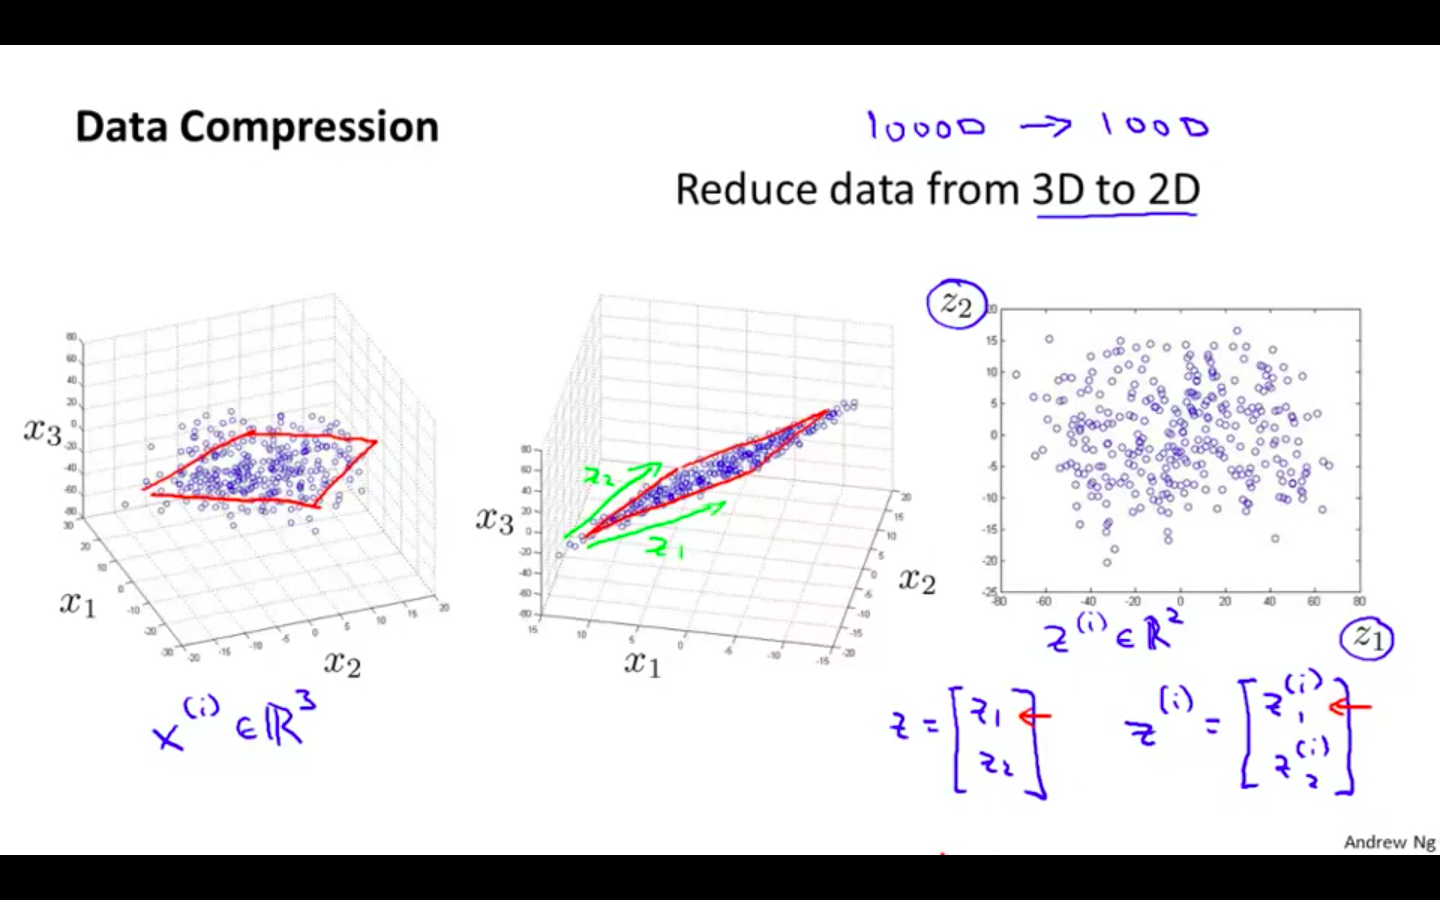
Data Compression
- Compressing the size of the data
-
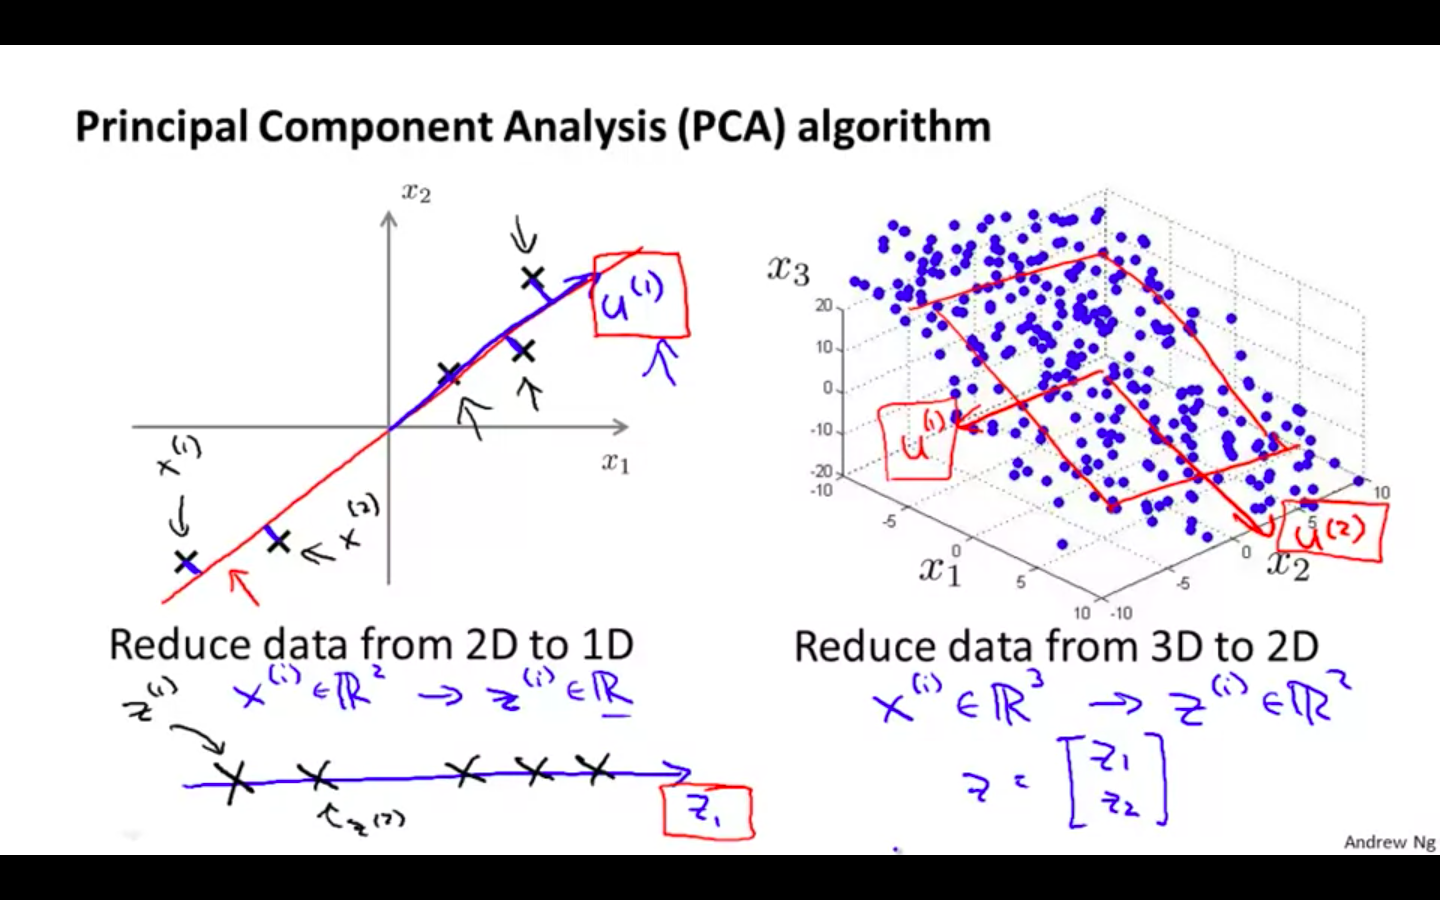
2D to 1D
-
3D to 2D
Motivation 2: Visualisation
-
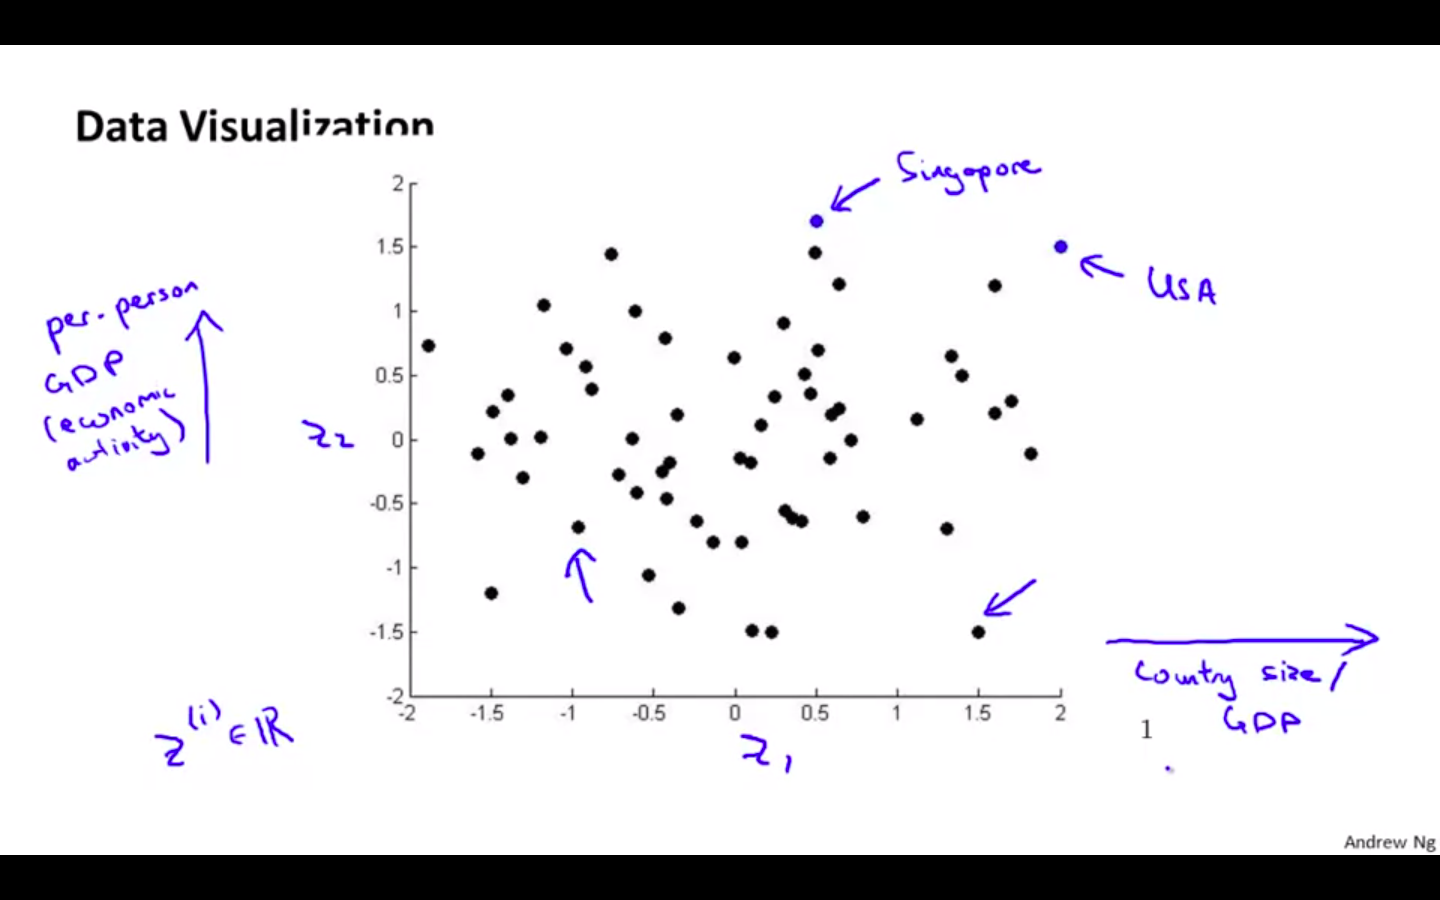
Data Visualisation
- Dataset of countries with many features
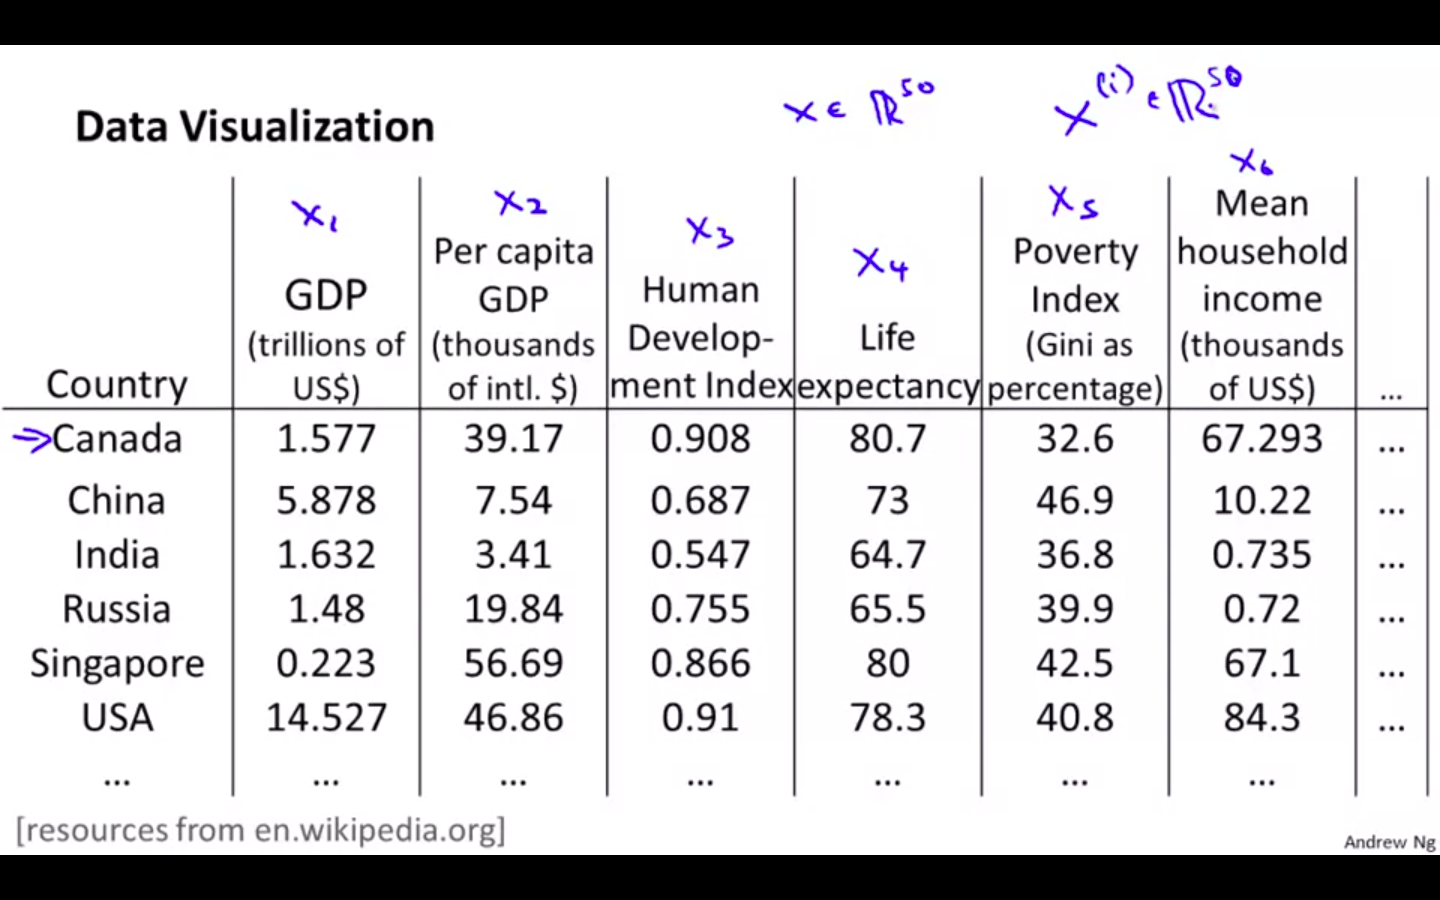
- Converting 50 D to 2 D
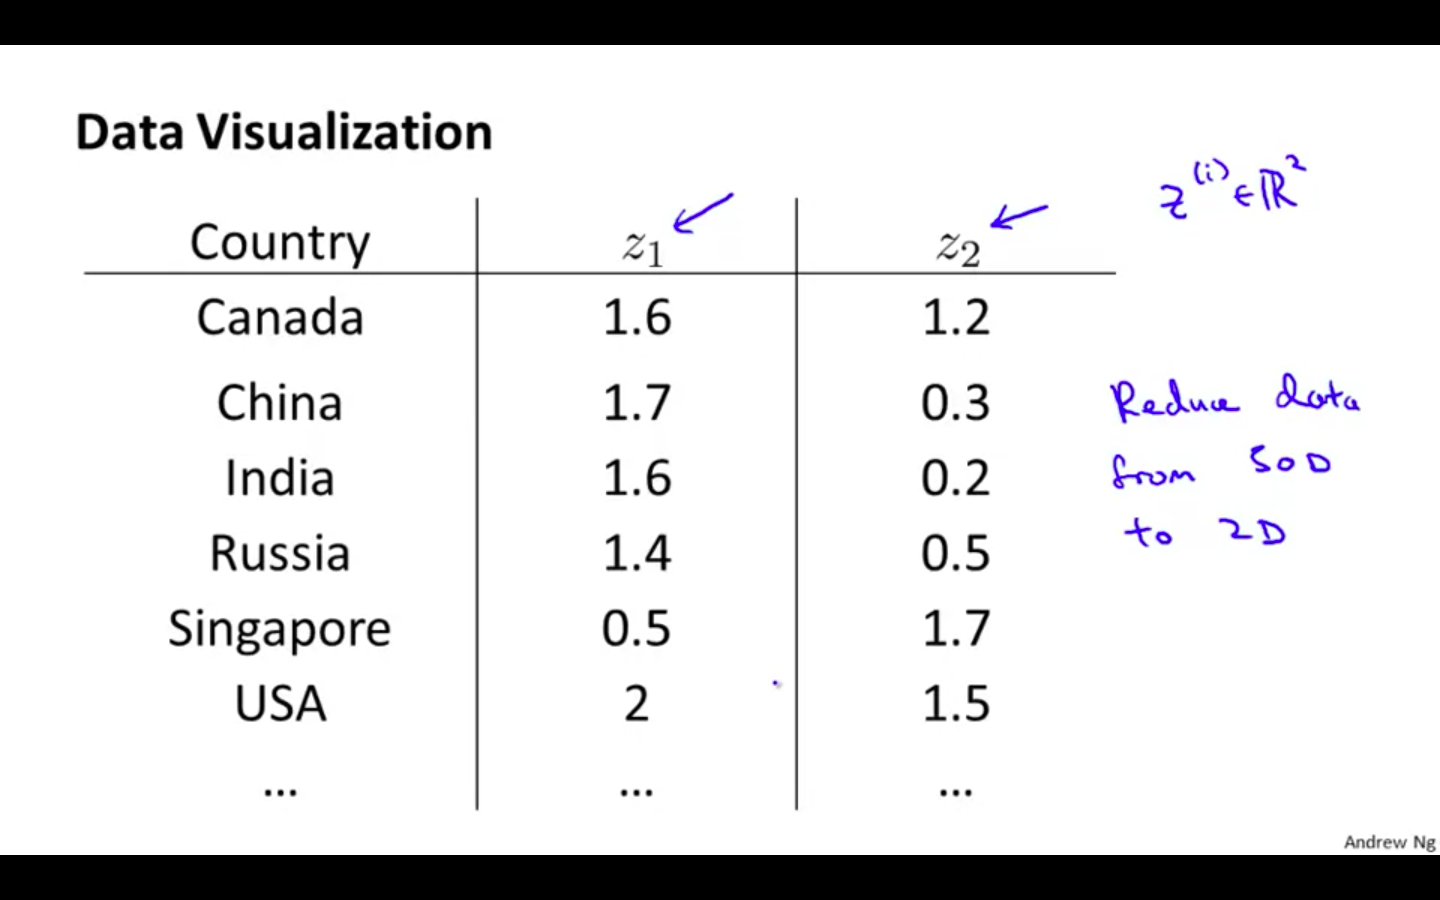
- Plotting the dataset
Principal Component Analysis
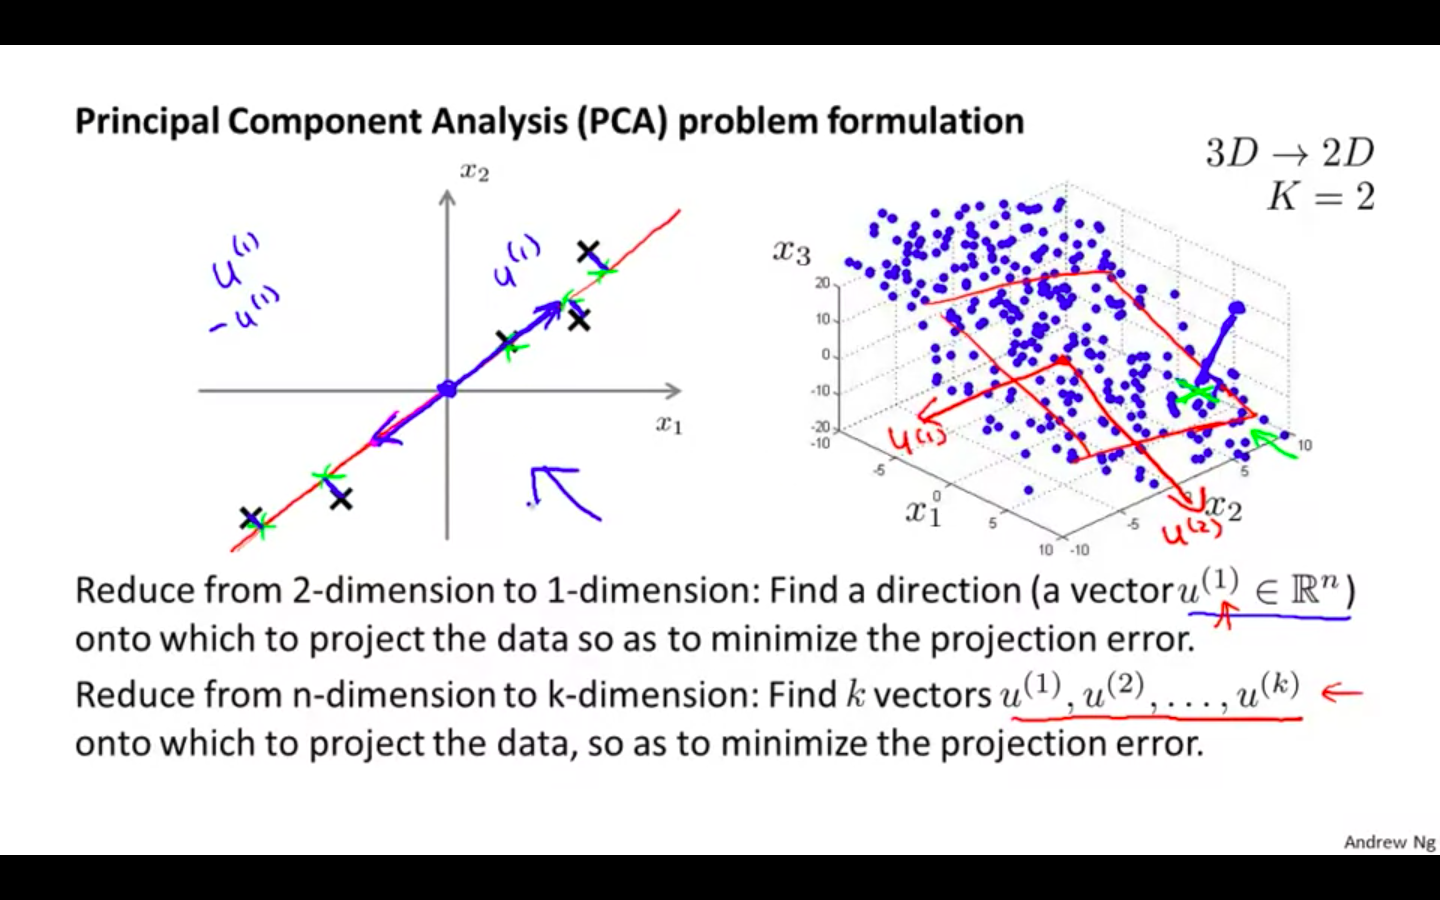
Principal Component Analysis Problem Formulation
-
PCA
- Dimension Reductionality Algorithm
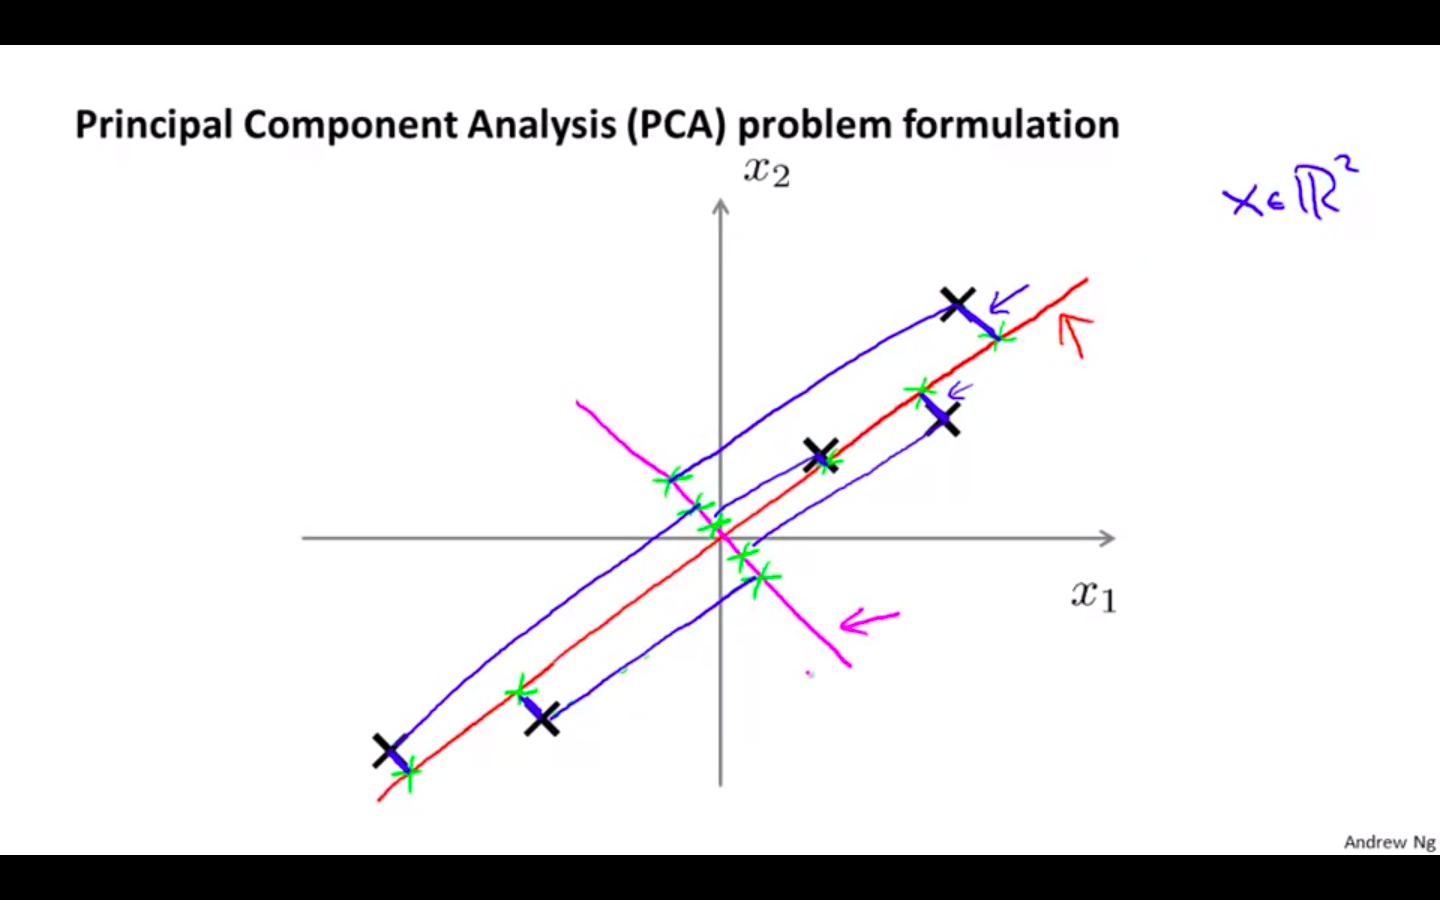
- Problem Formulation
-
PCA is not Linear Regression
-
In linear regression, the error is draw 90 degree from the line to the data point
-
In PCA, the projection error is drawn at a angle from the line to the data point
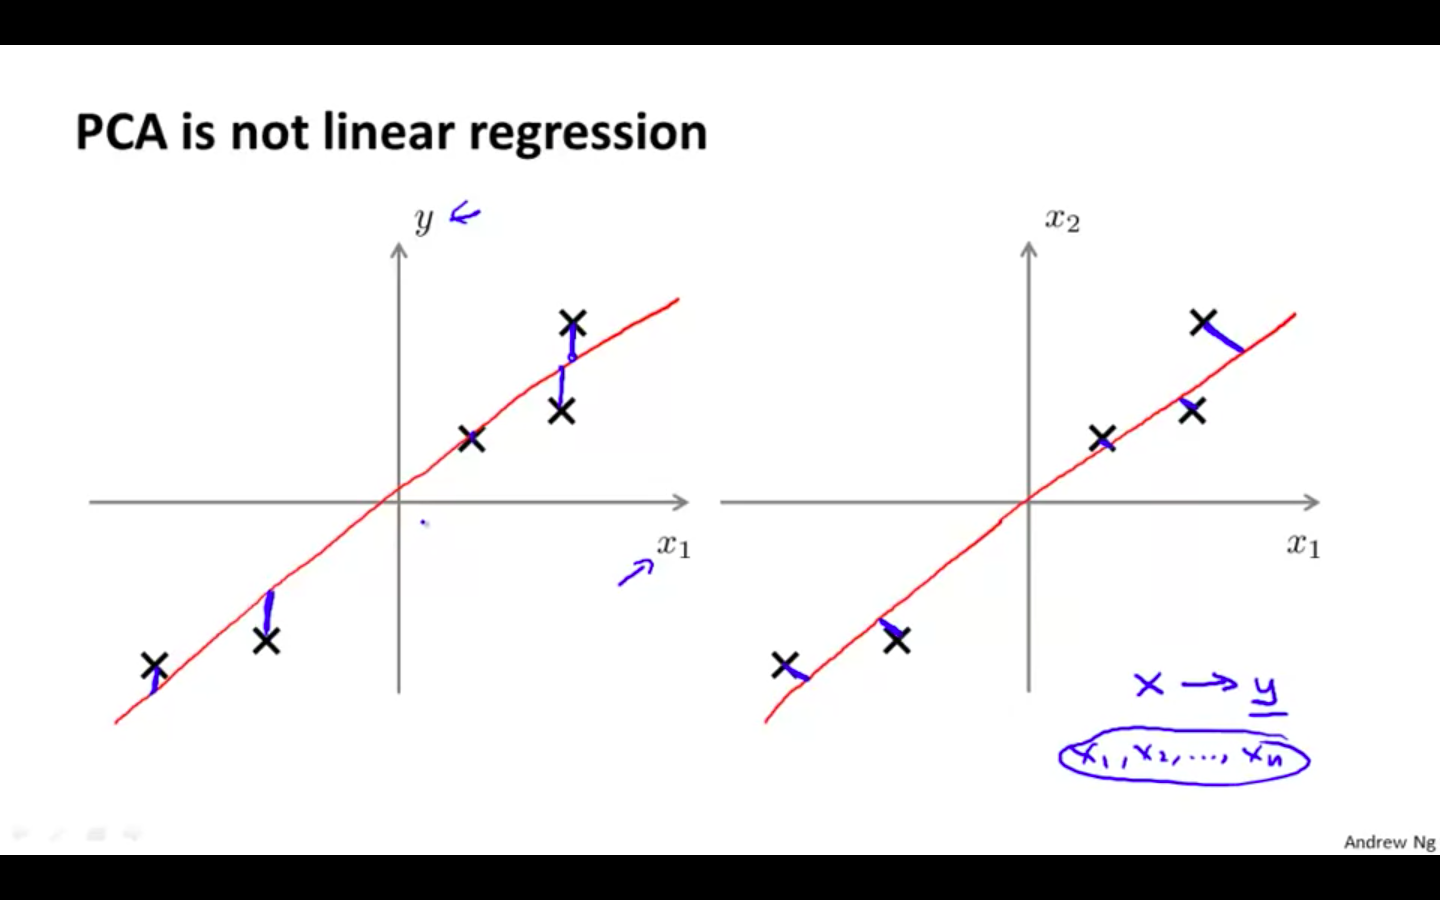
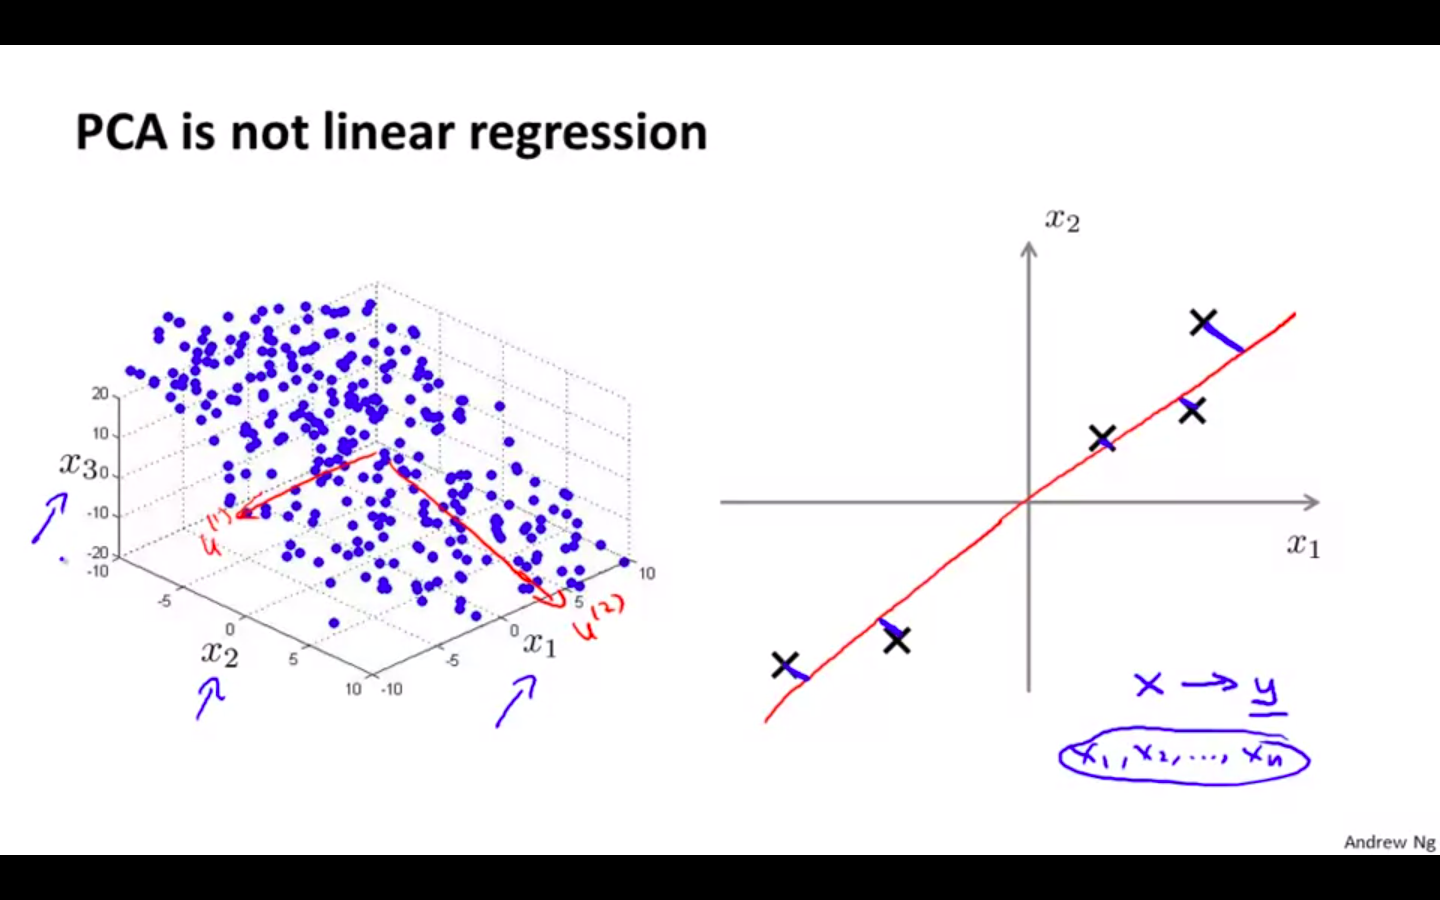
-
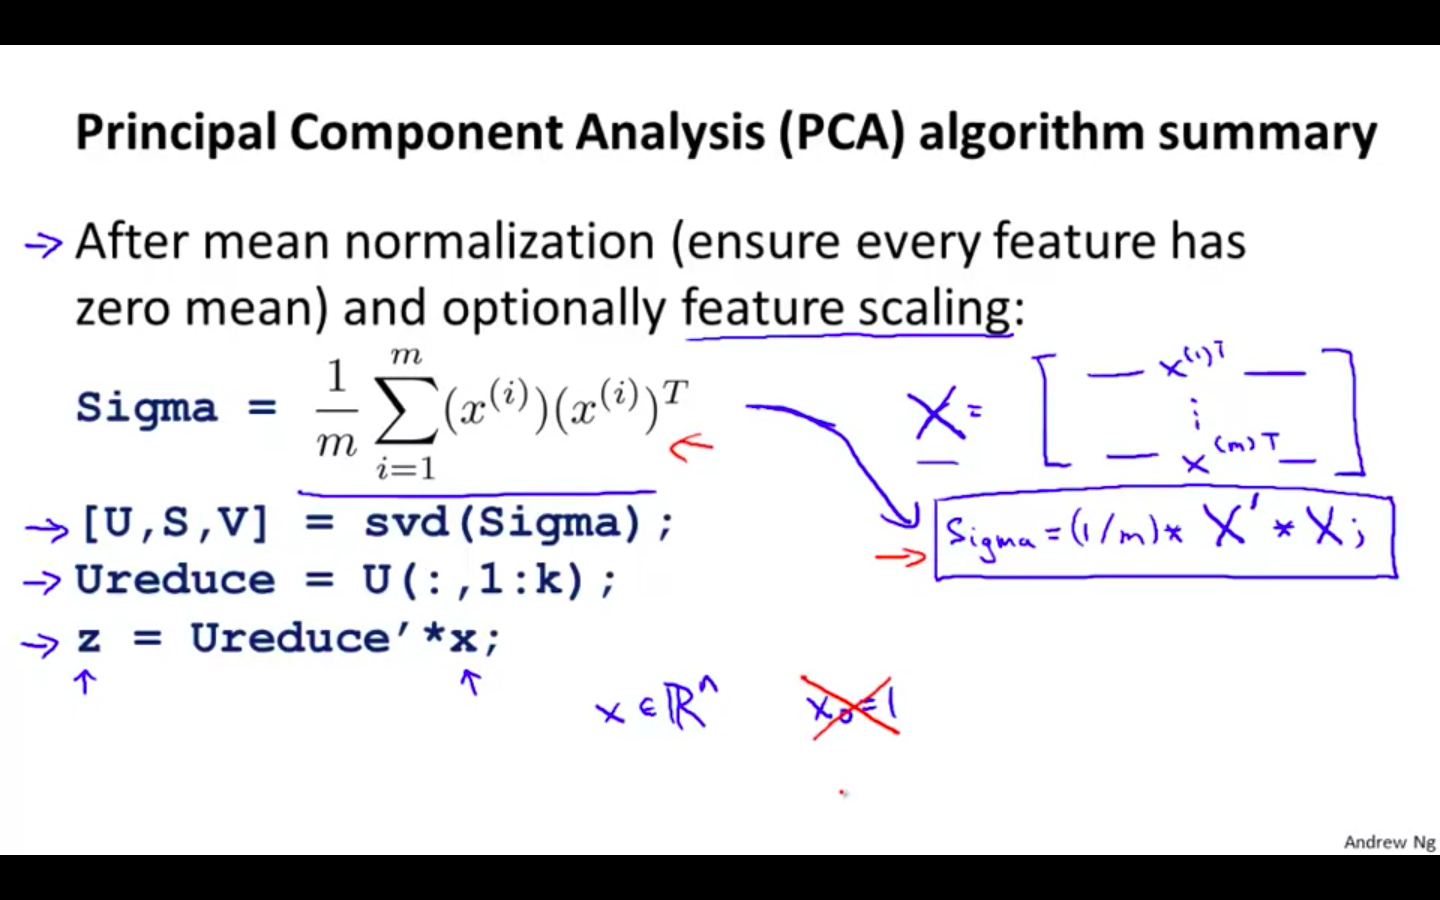
Principal Component Analysis Algorithm
-
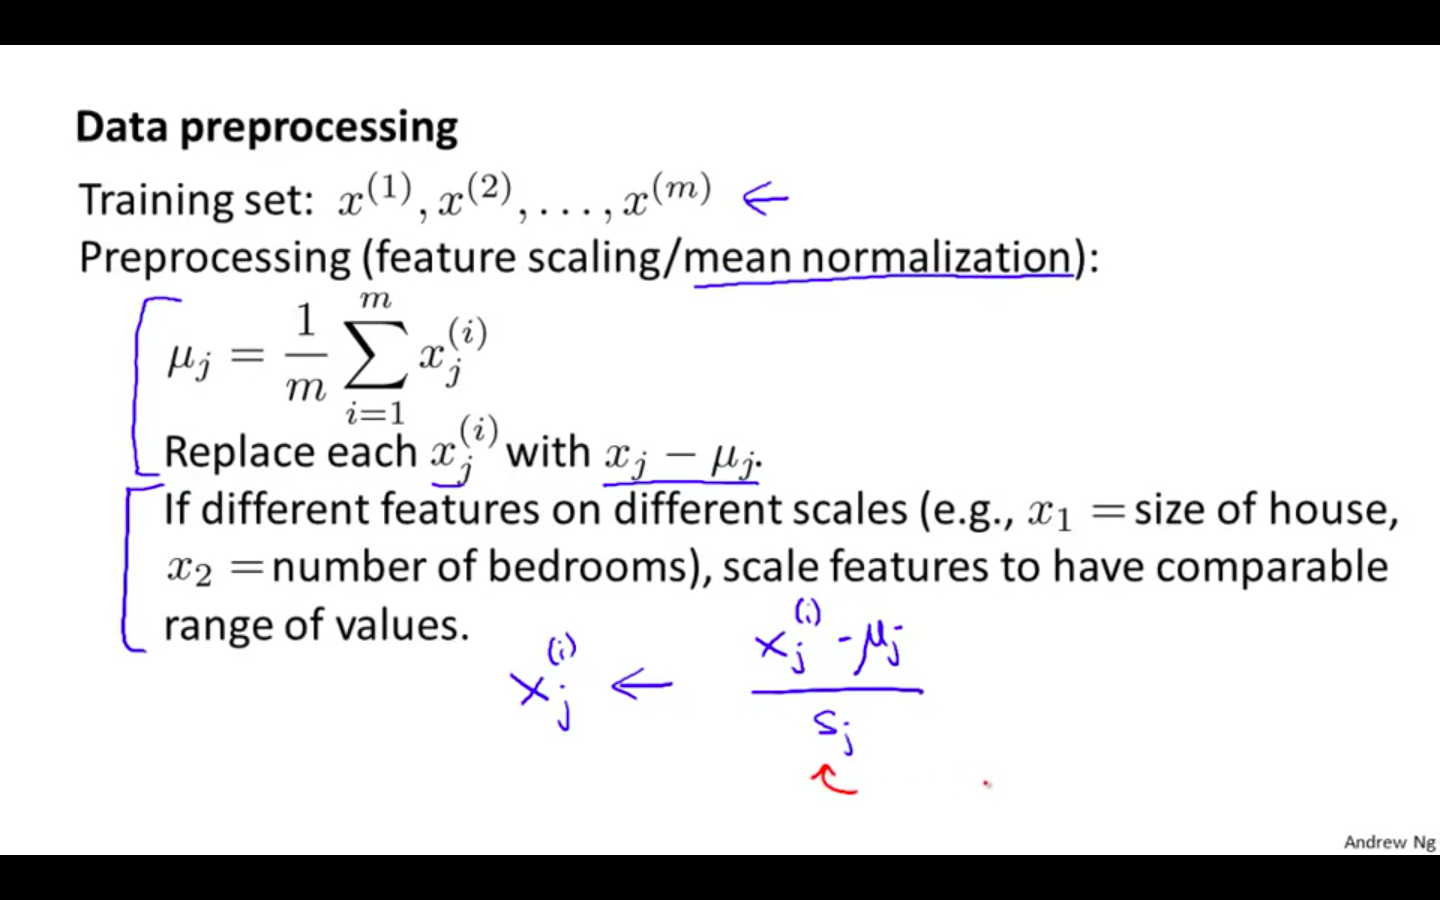
Data Preprocessing
- Mean Normalisation
-
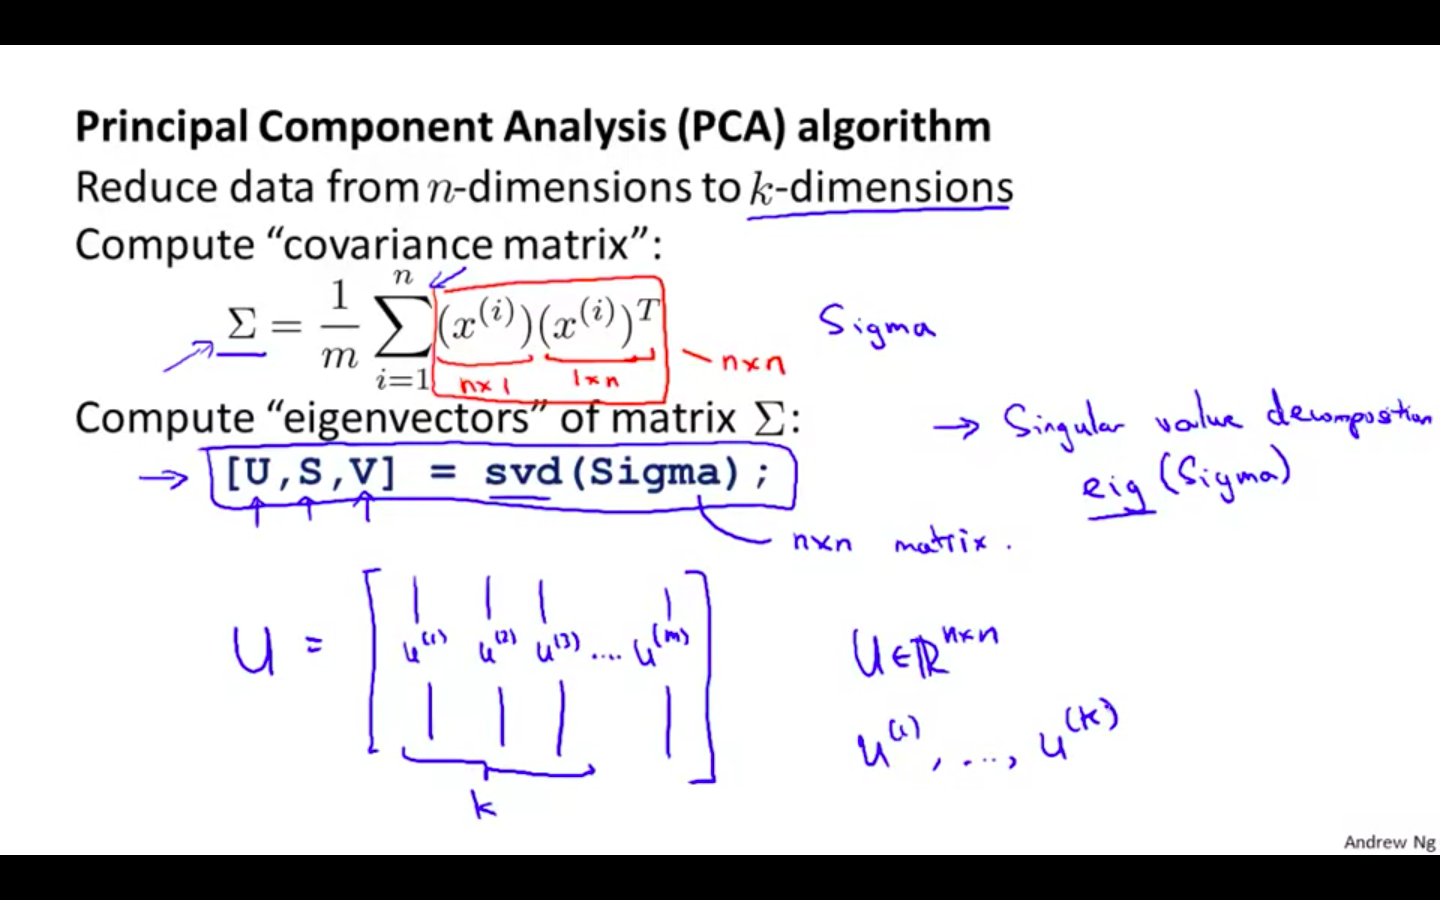
PCA Algorithm
- Reducing dimension of data
-
Compute ‘Covariance Matrix’
-
Compute ‘eigenvectors’ of matrix
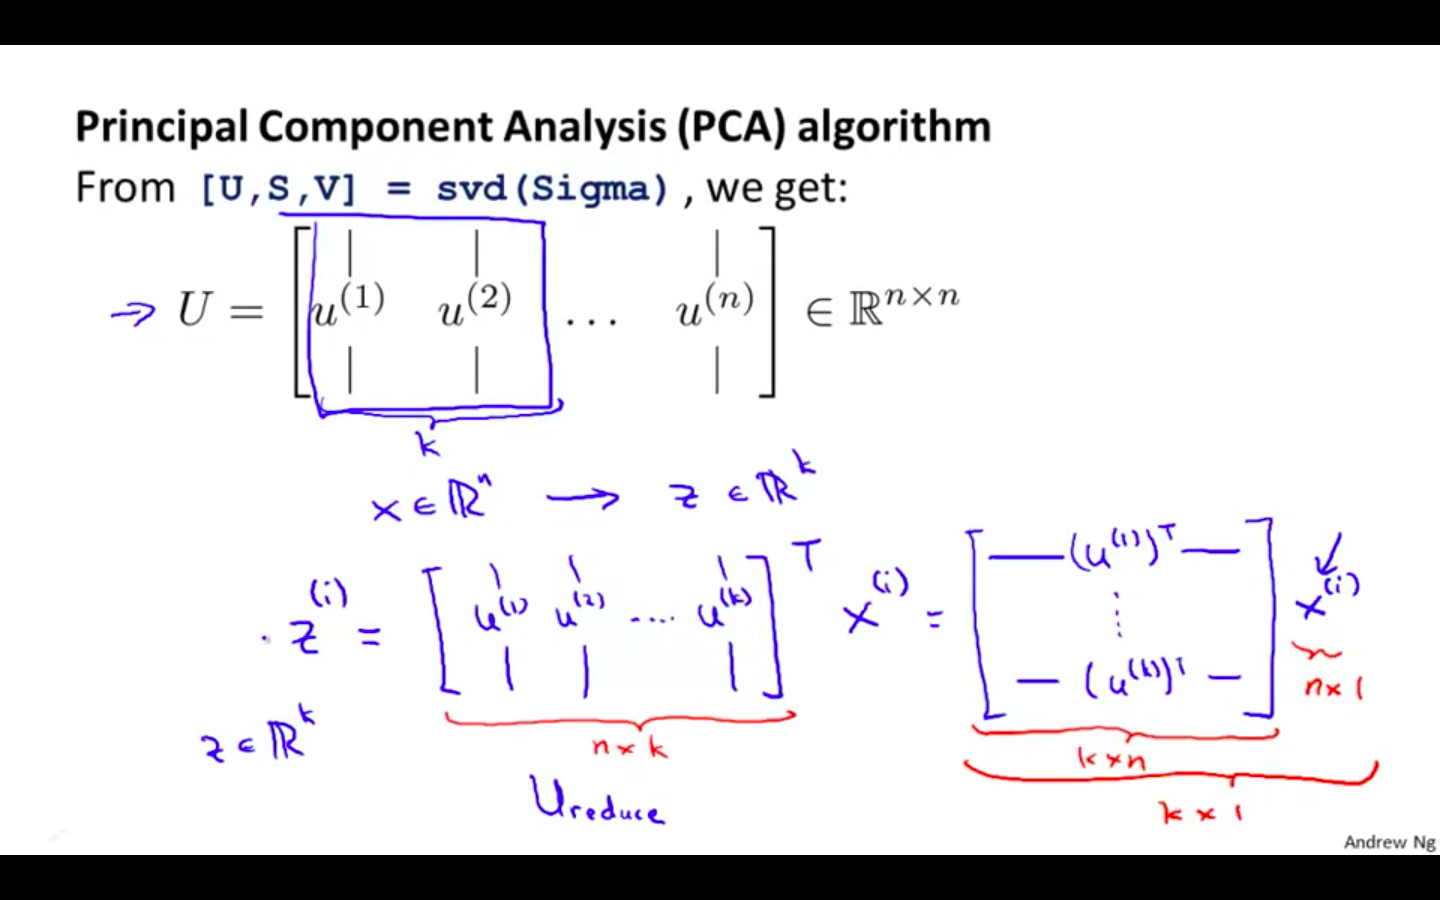
- Summary
Applying PCA
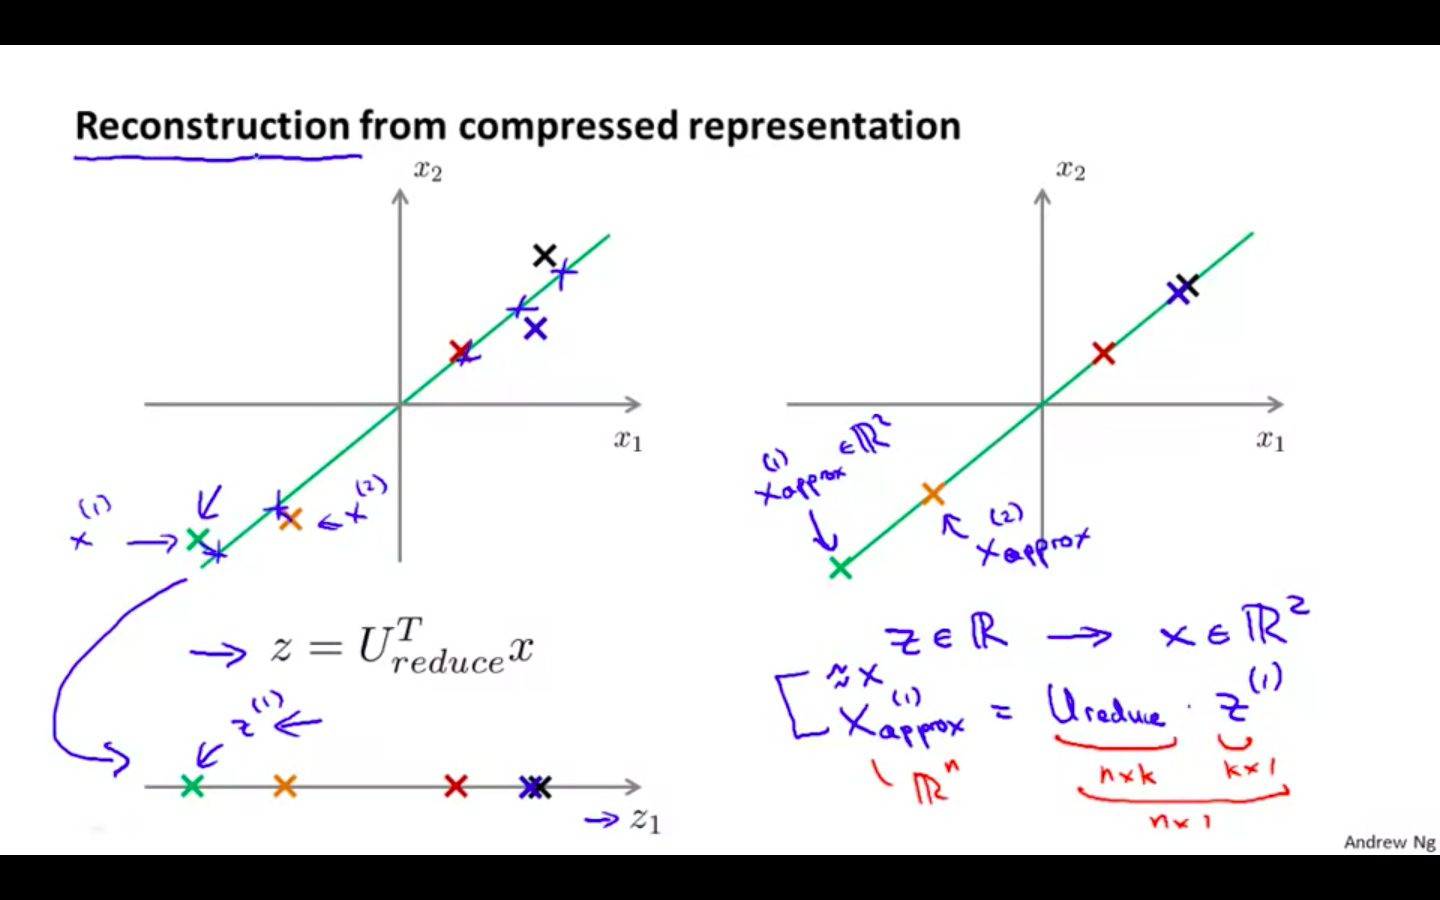
Reconstruction from Compressed Representation
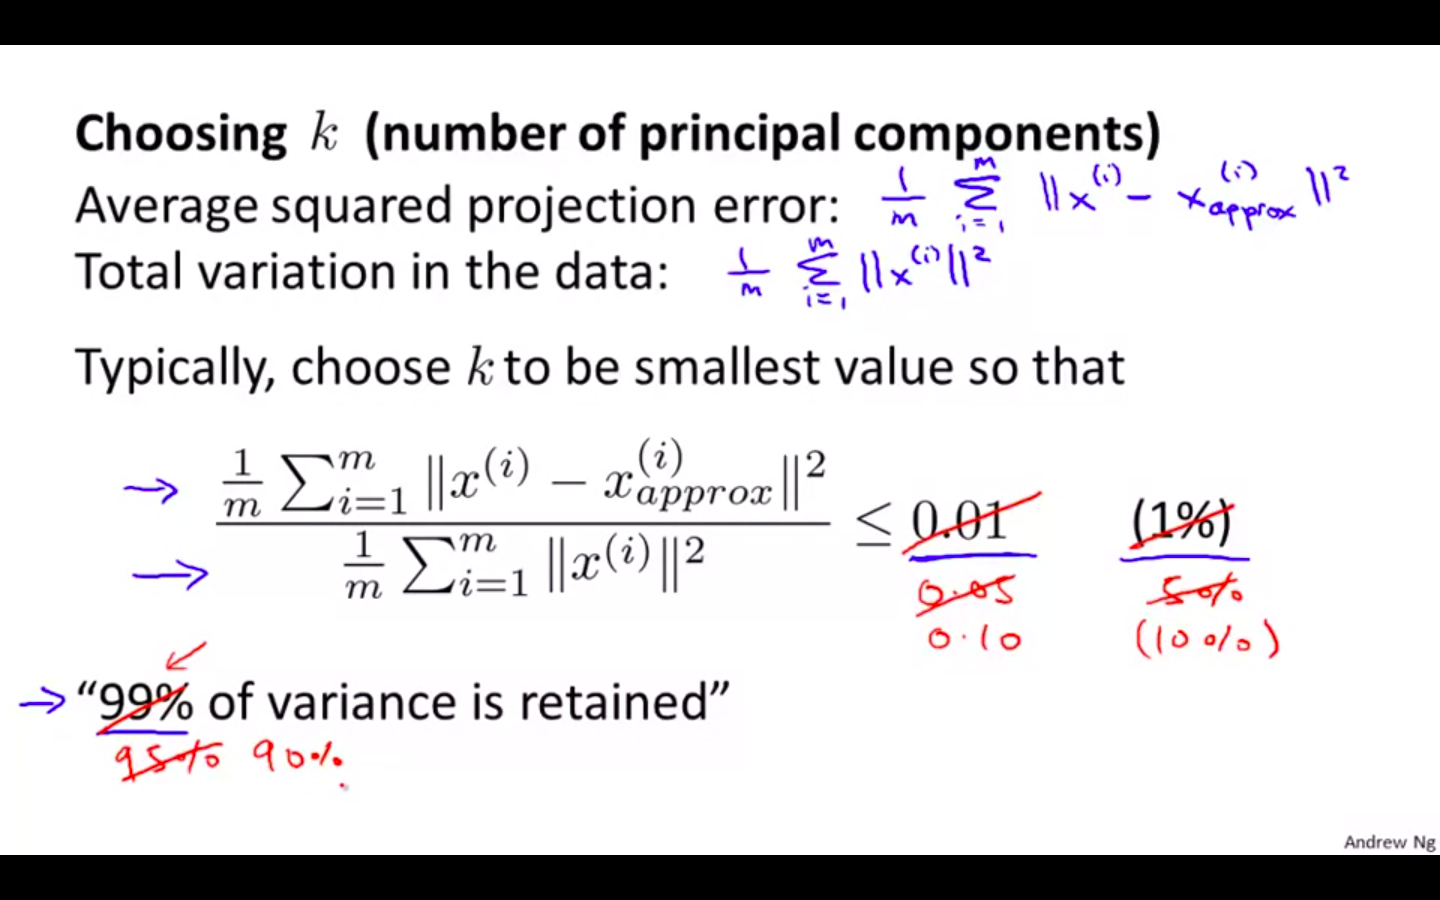
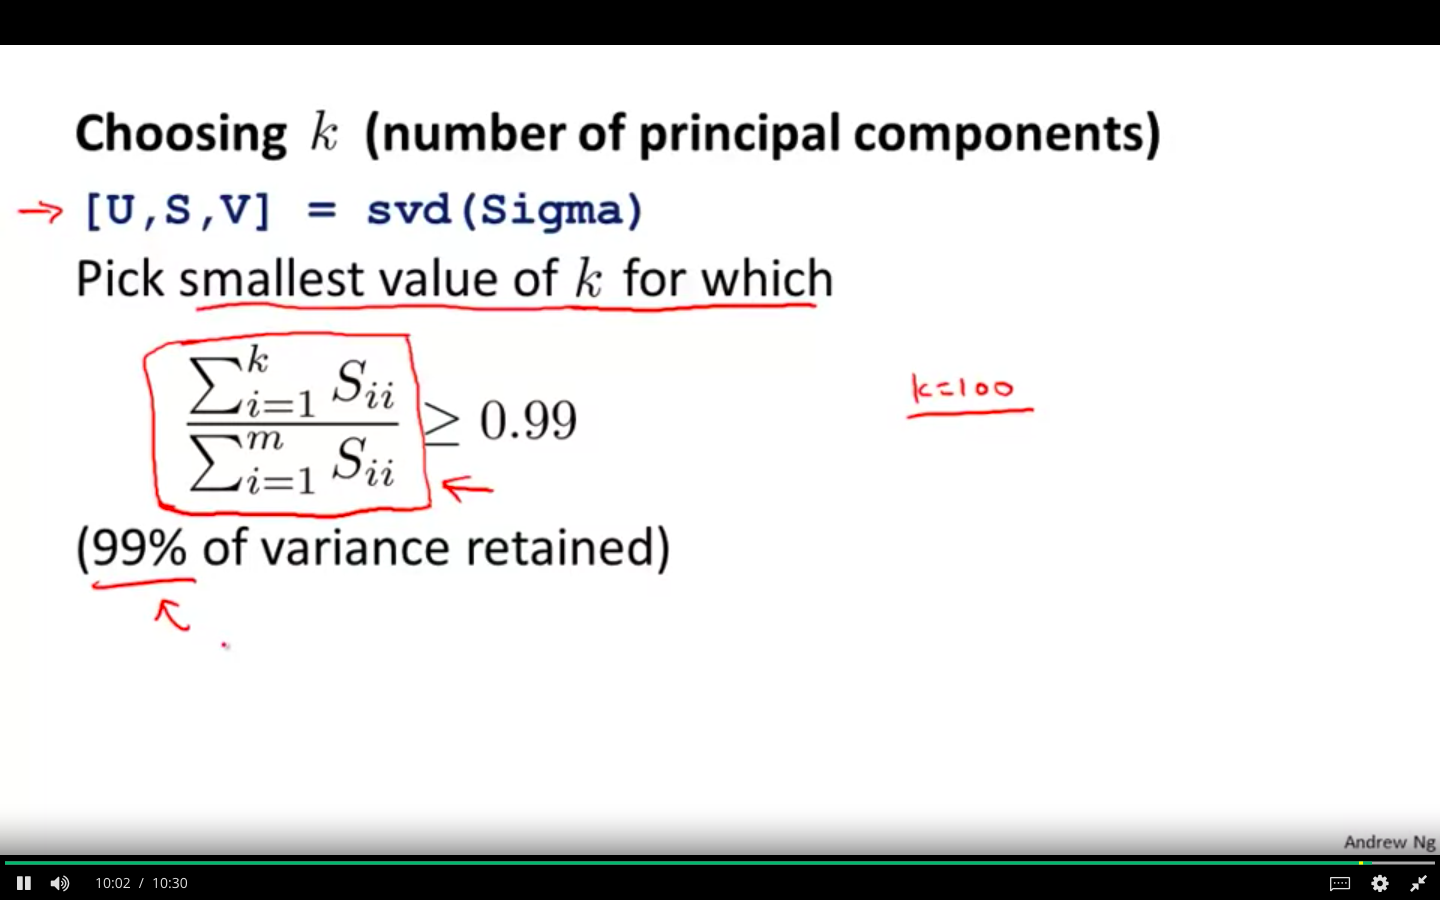
Choosing the Number of Principal Components
-
Choosing k ( number of principal components )
-
Average squared projection error / Total variation in the data ≤ 0.01
-
99 % of variance is retained
-
-
Different Algorithms
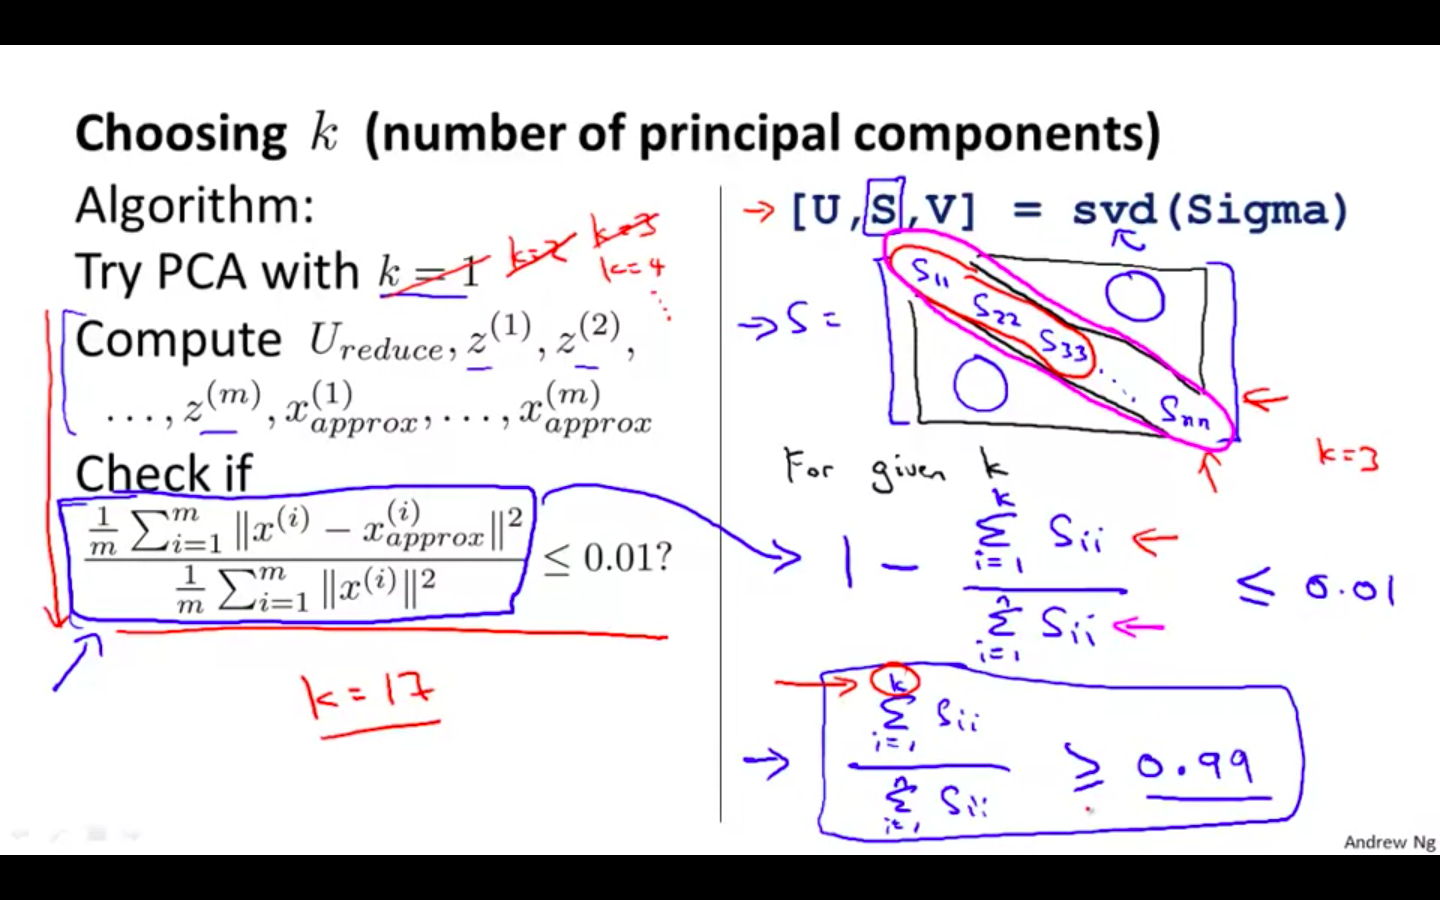
-
Recommended Method
Advice for Applying PCA
-
Supervised Learning Speedup

-
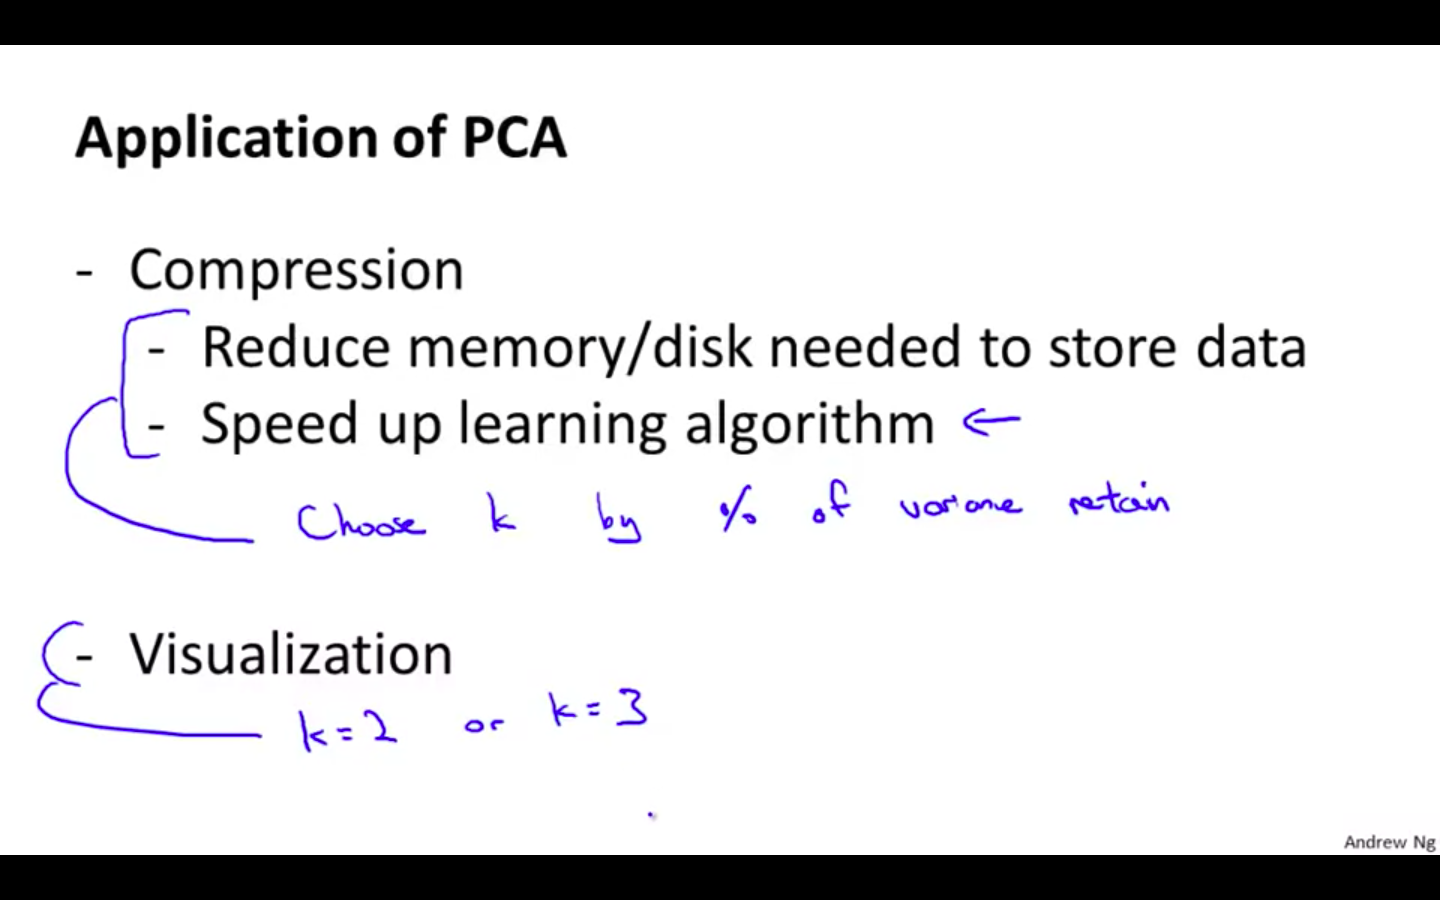
Applications
-
Compression
-
Reduce memory / disk needed to store data
-
Speed up learning algorithm
-
-
Visualisation
-
-
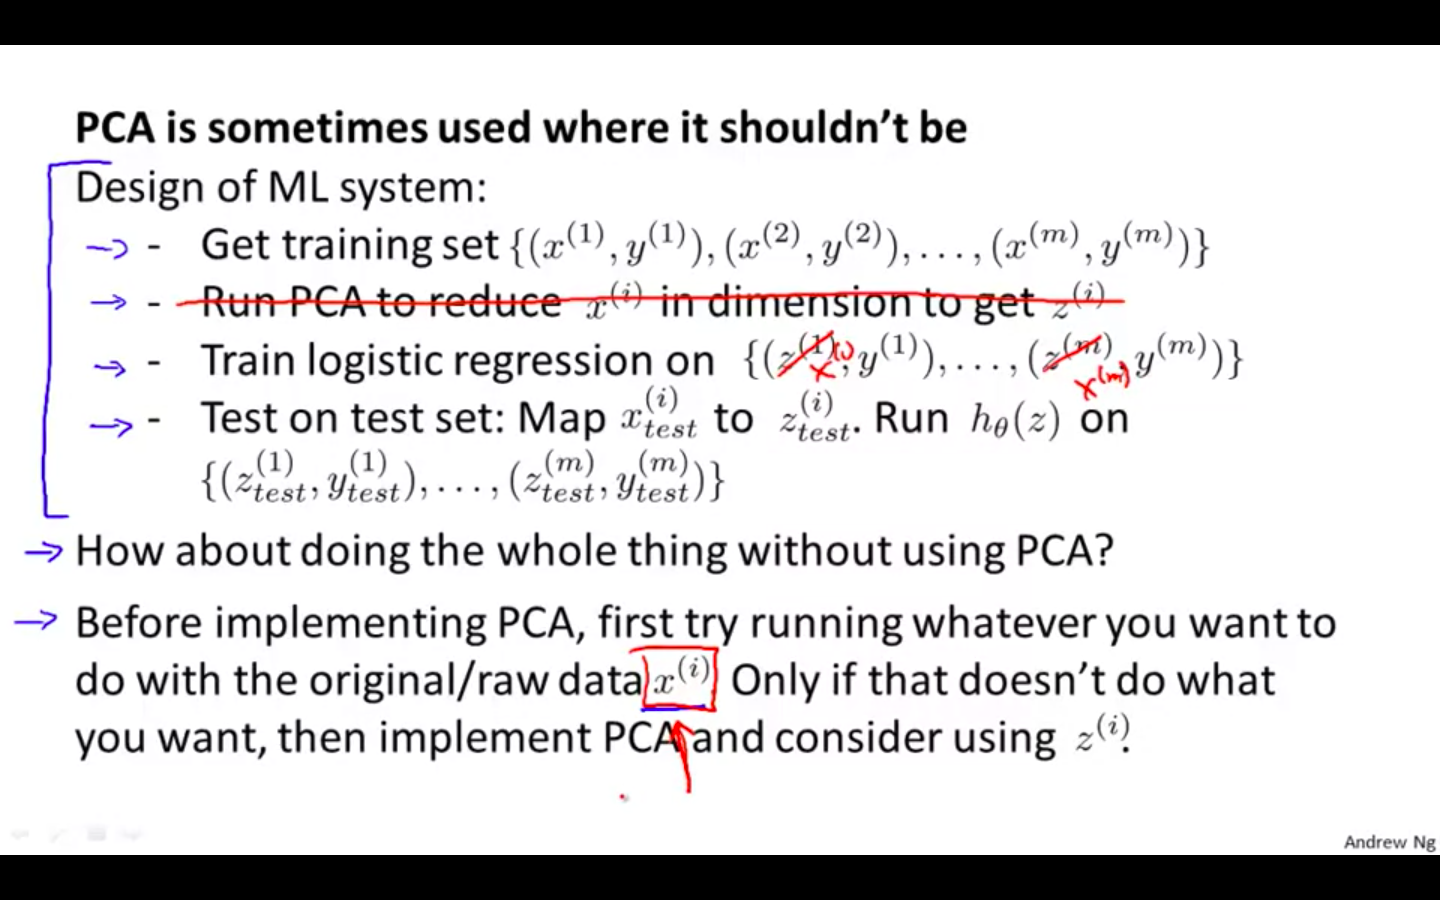
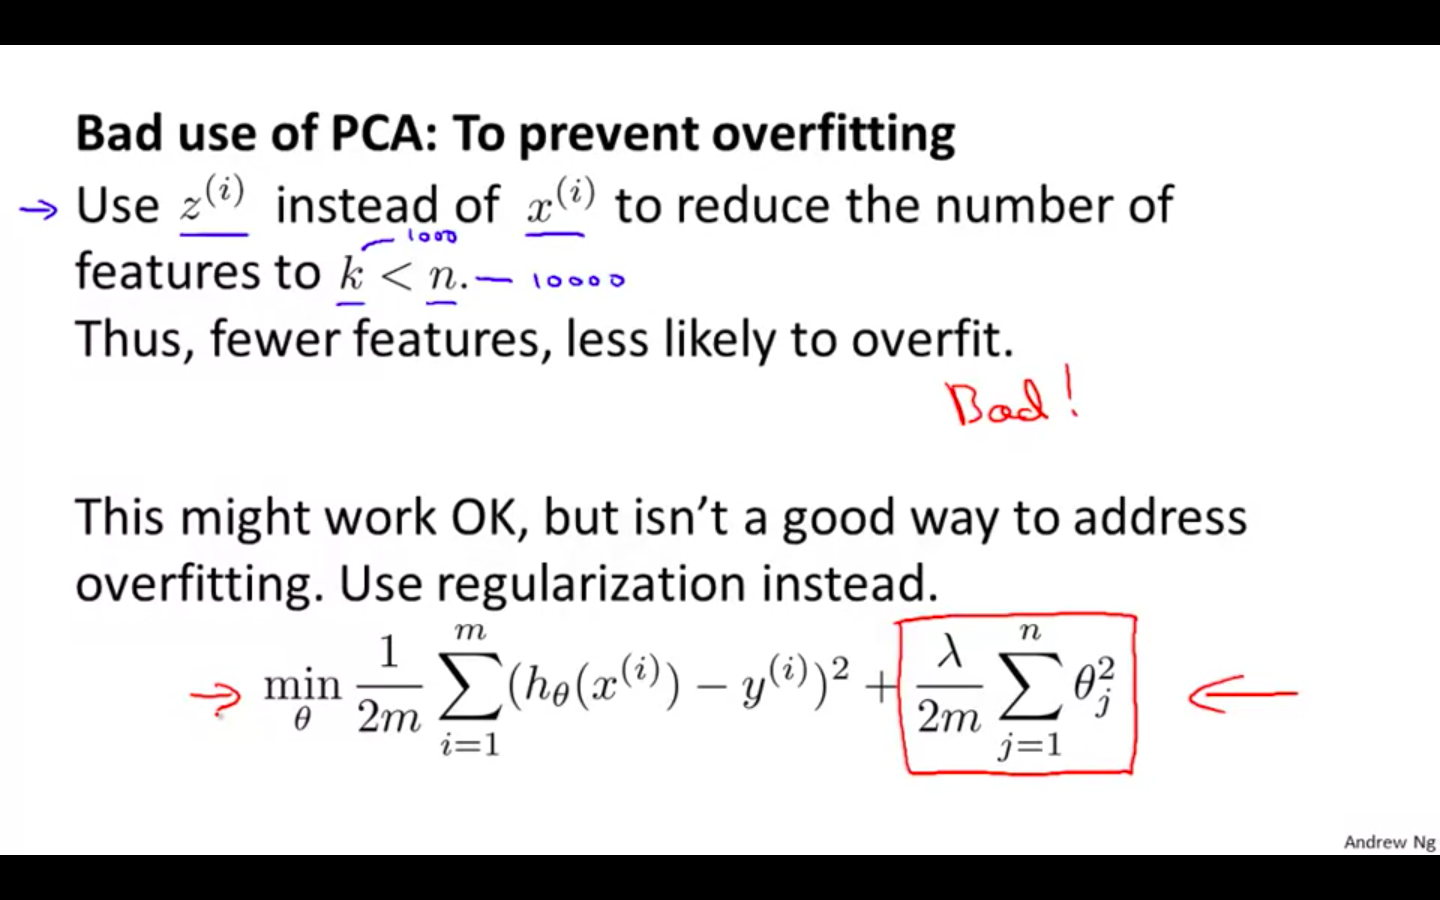
Bad Use
-
Where it shouldn’t be used