Machine Learning By Andew Ng - Week 9
Density Estimation
Problem Motivation
-
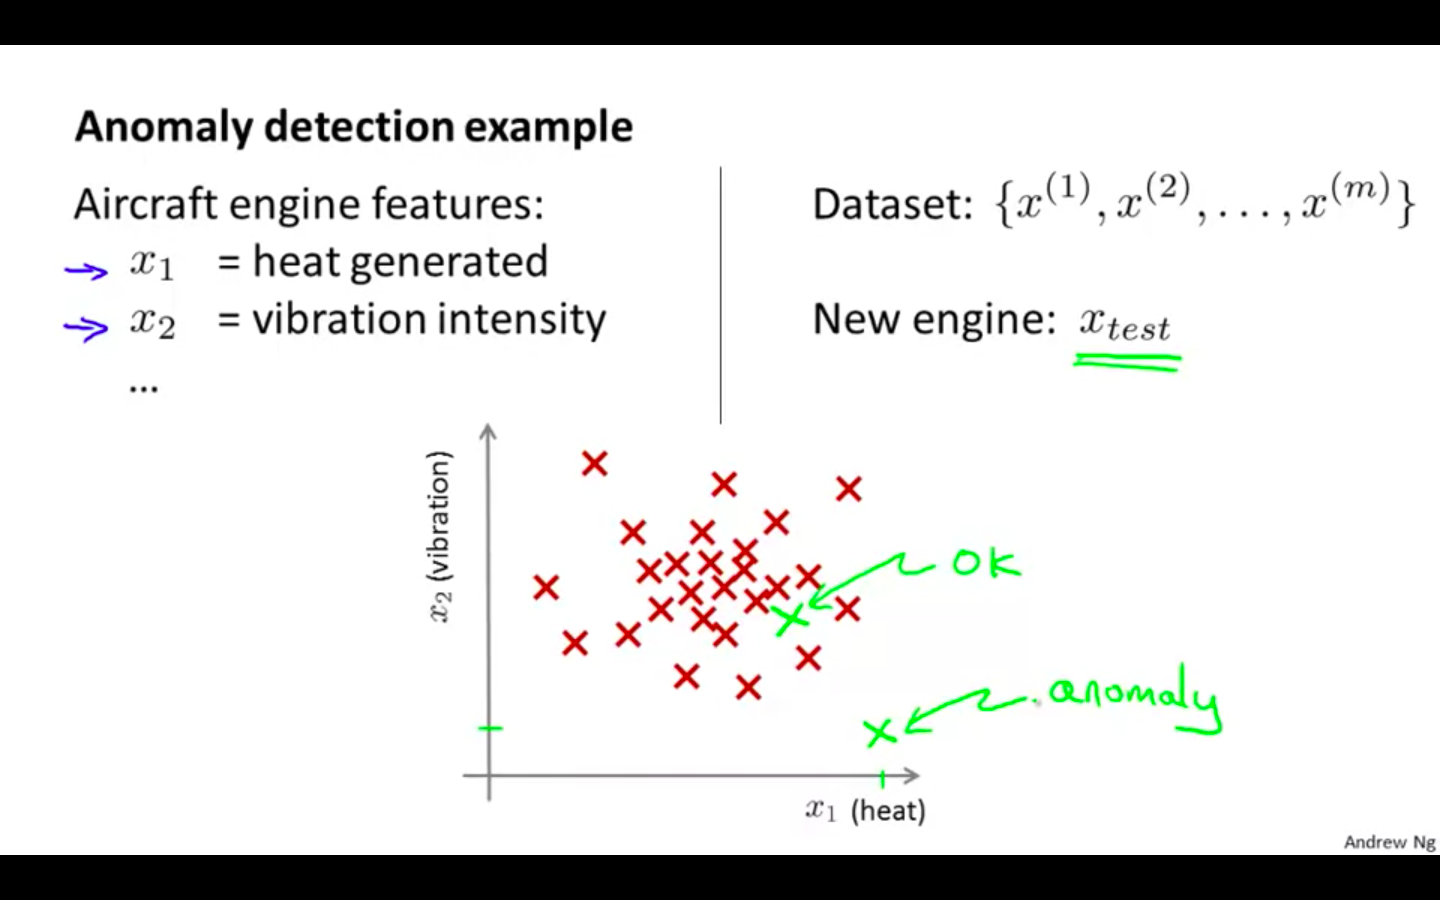
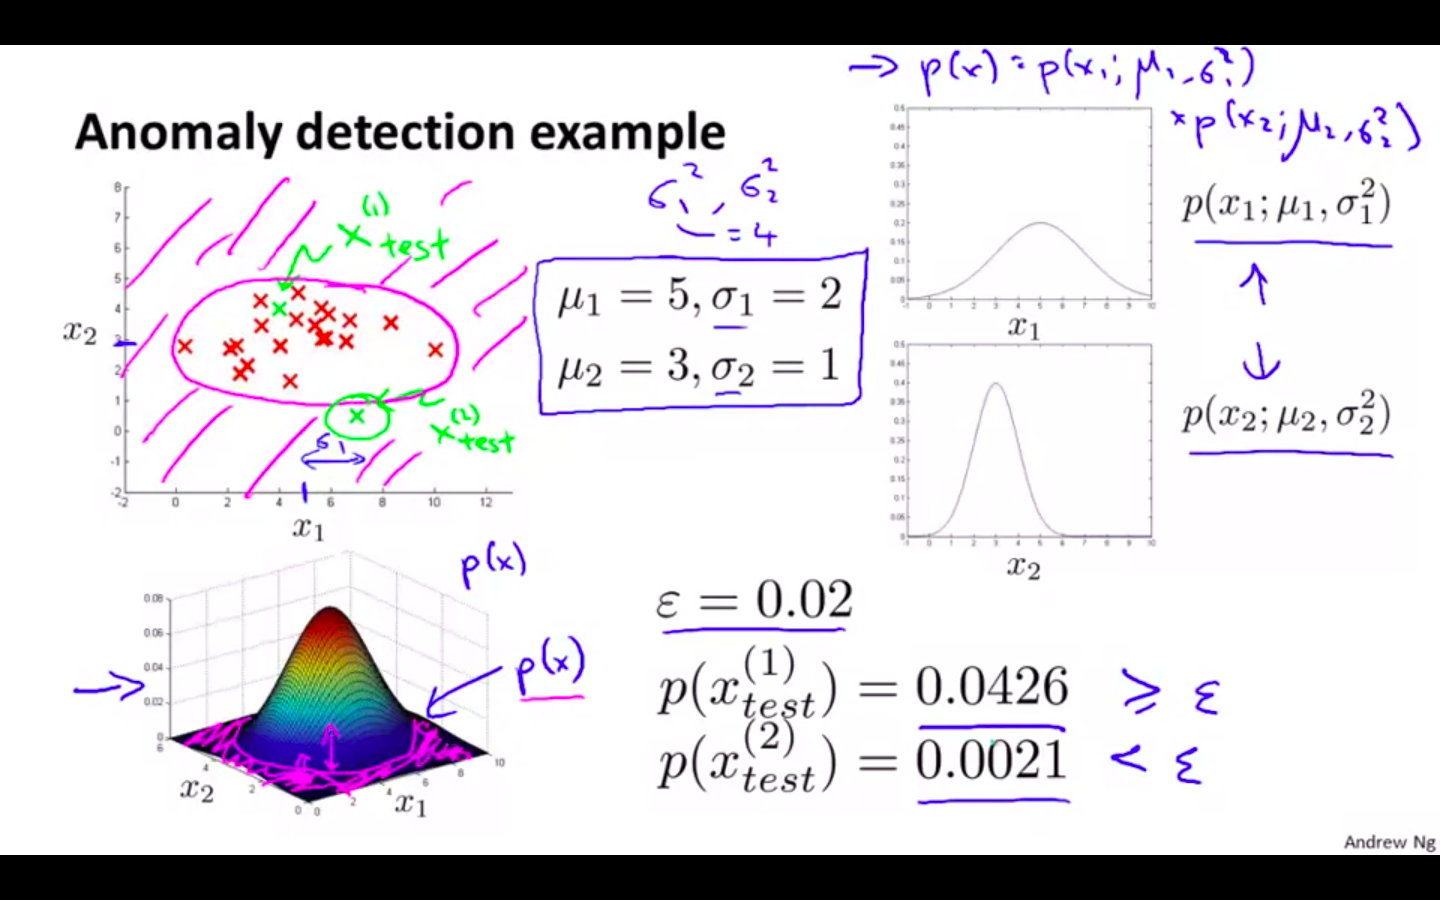
Anomaly Detection Example
-
Plotting the dataset, and compare it with the new datapoint for its behaviour
-
If its in the same range as the dataset then the new datapoint is identified as ok
-
It its not in the same range as the dataset then the new datapoint is flagged as anomaly
-
-
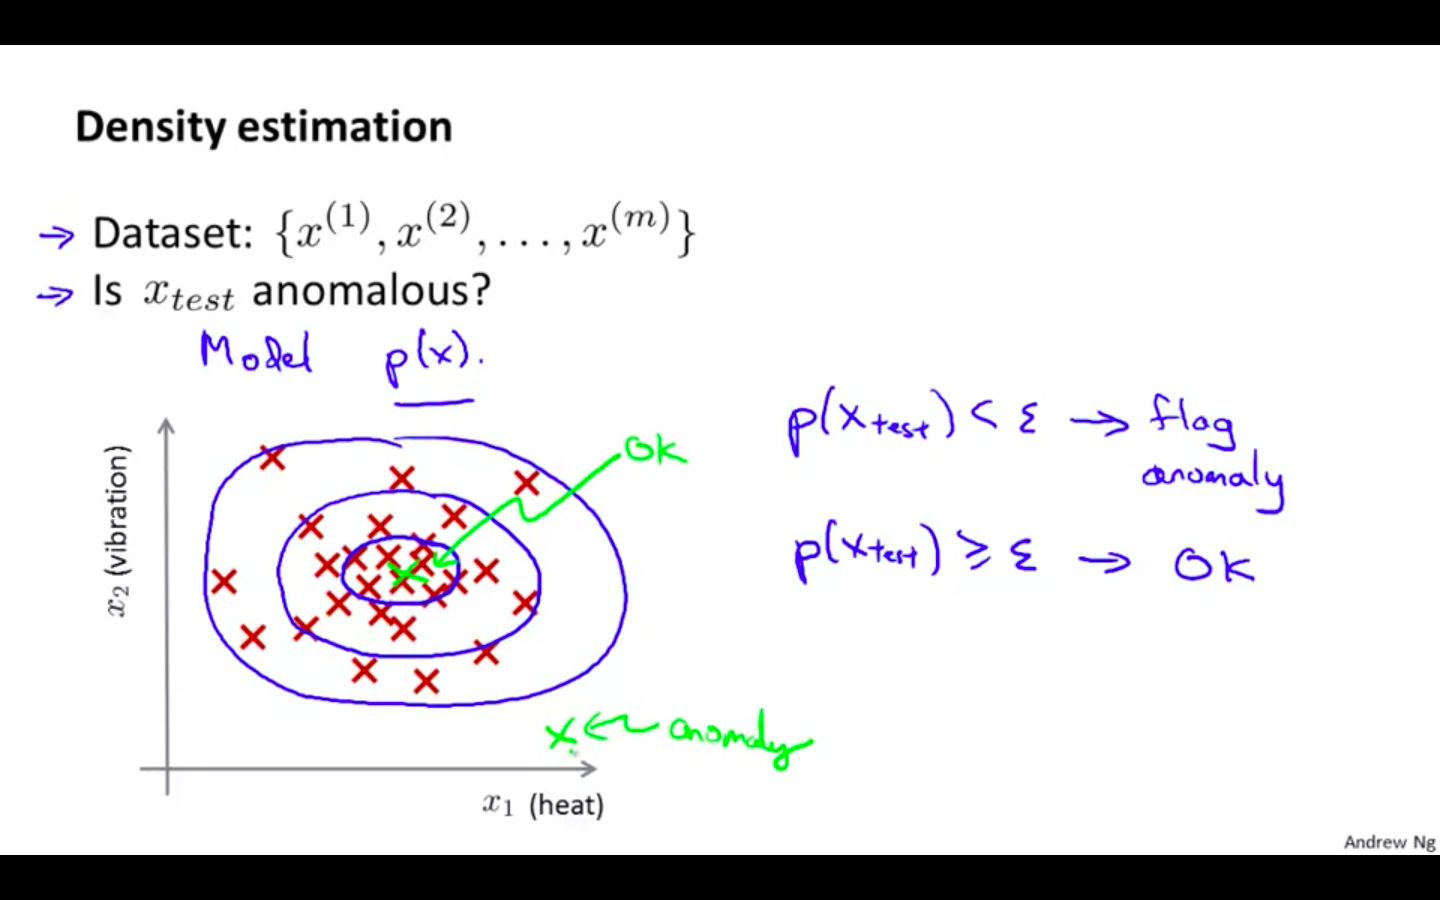
Density Estimation
-
If new datapoint is less than some value ( epsilon ) then flagged as anomaly
-
If new datapoint is equal to or more than some value ( epsilon ) then identified as ok
-
-
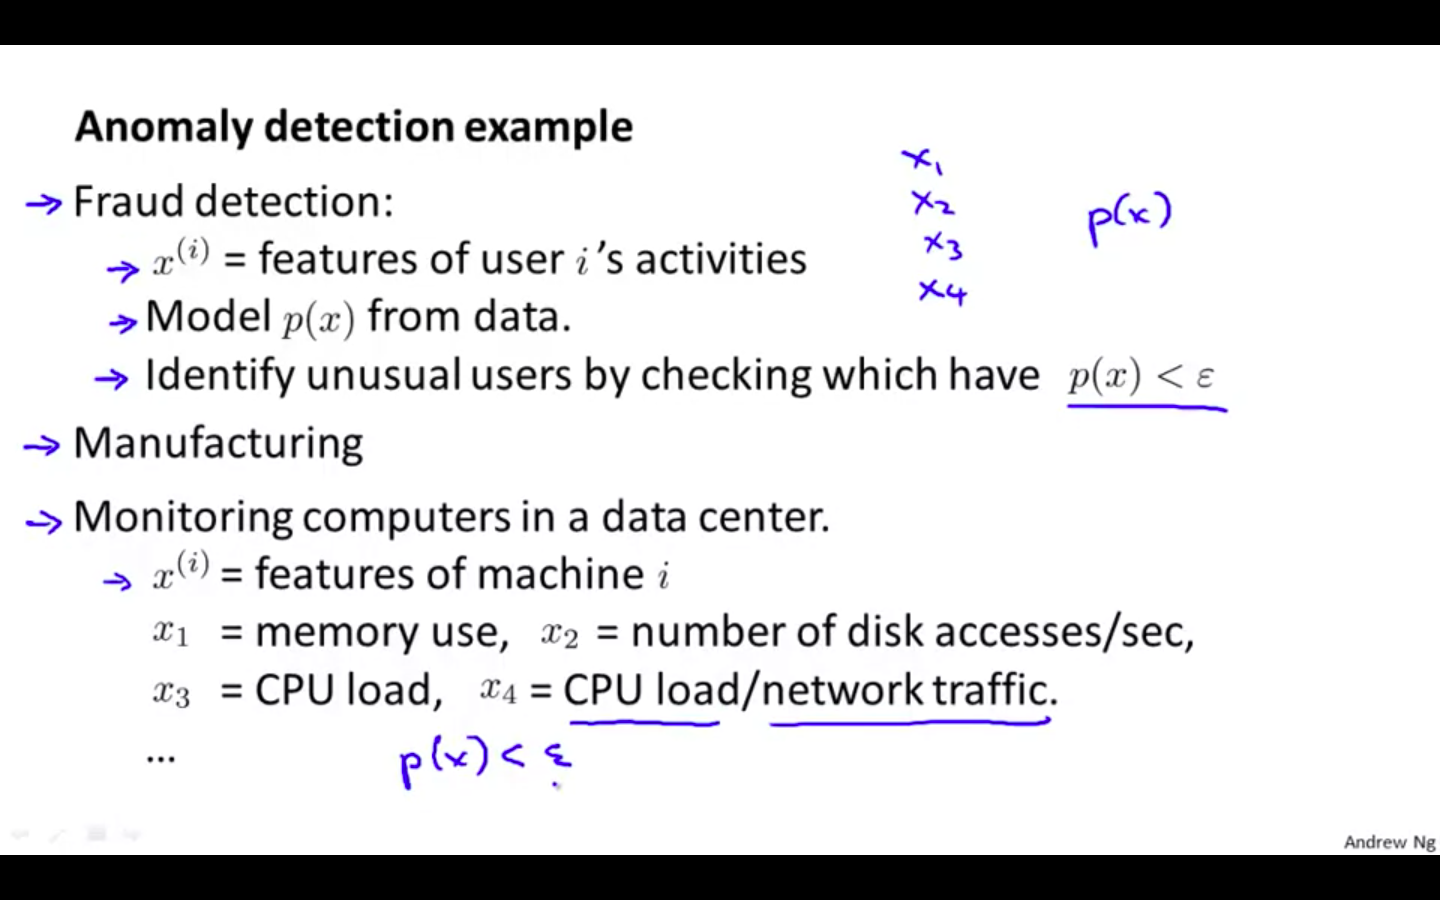
Anomaly Detection Applications
-
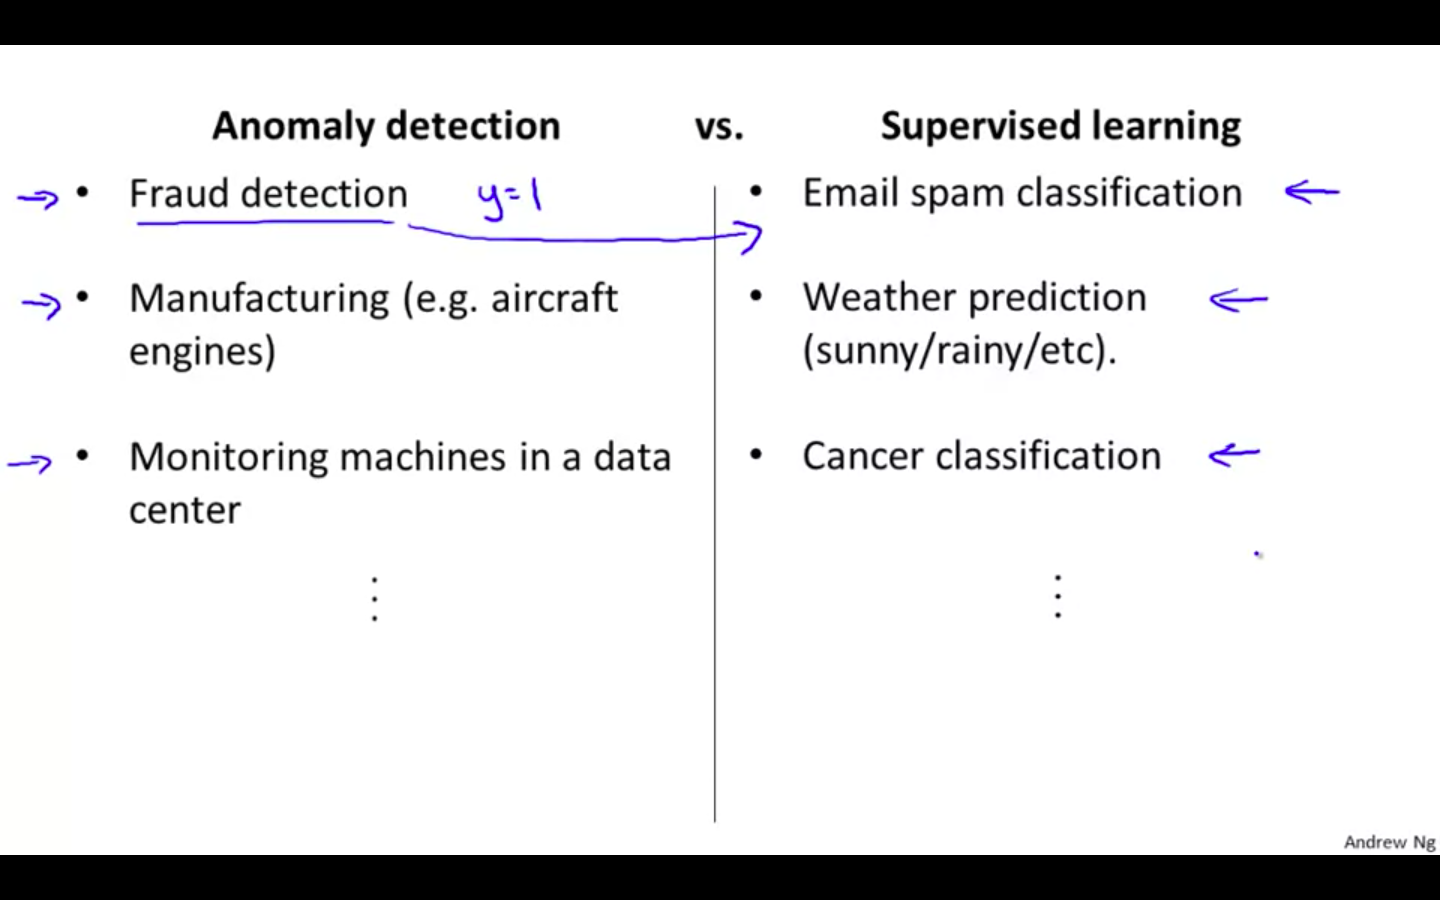
Fraud Detection
-
Manufacturing
-
Monitoring computers in a data center
-
Gaussian Distribution
-
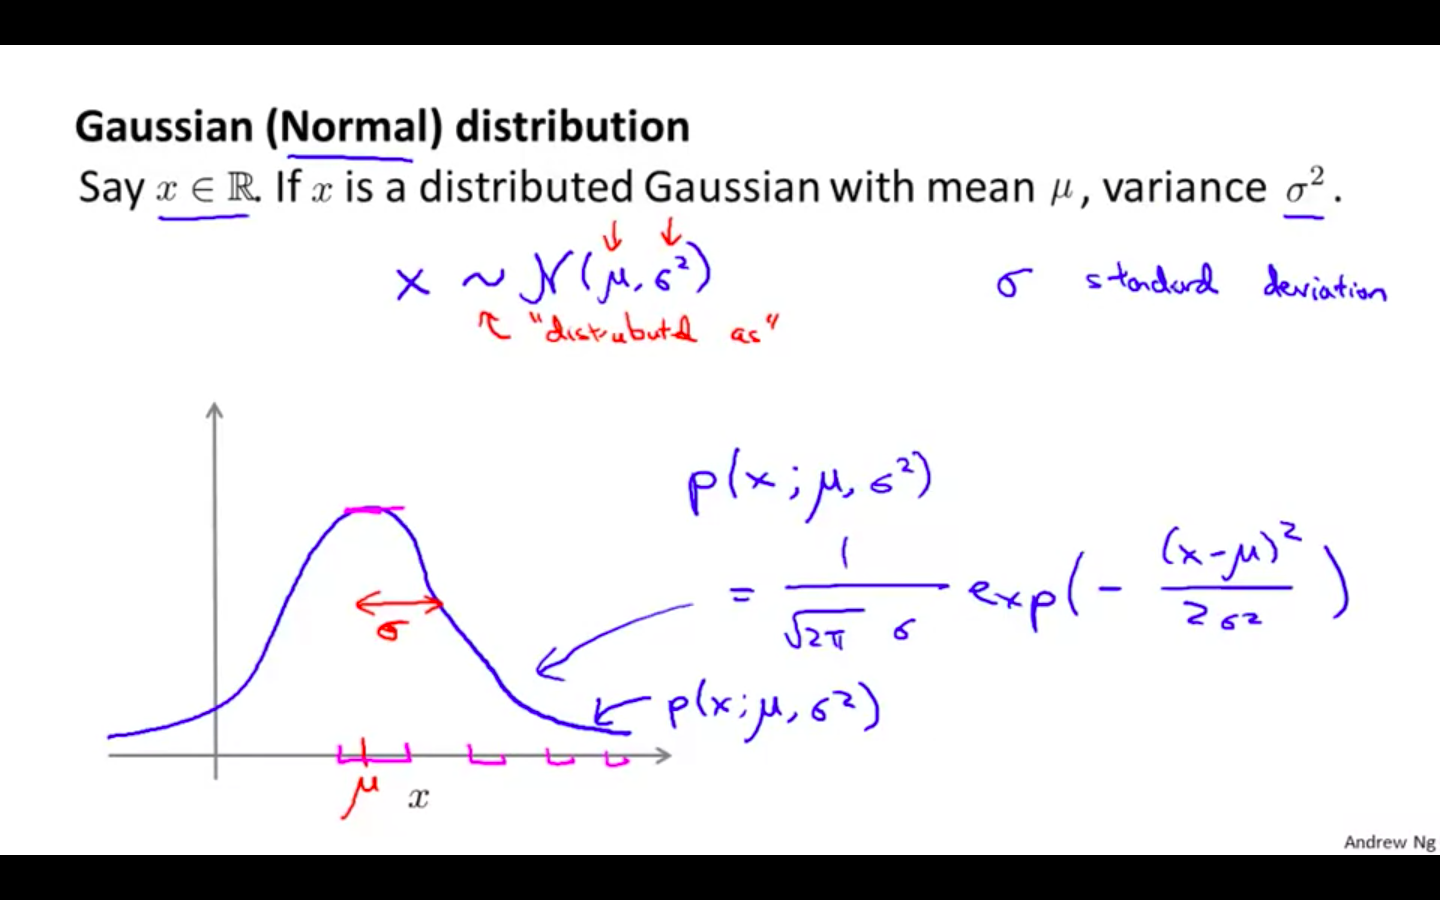
Gaussian Distribution
-
Say x belongs to Real Number.
-
If x is a distributed Gaussian with mean and variance
-
-
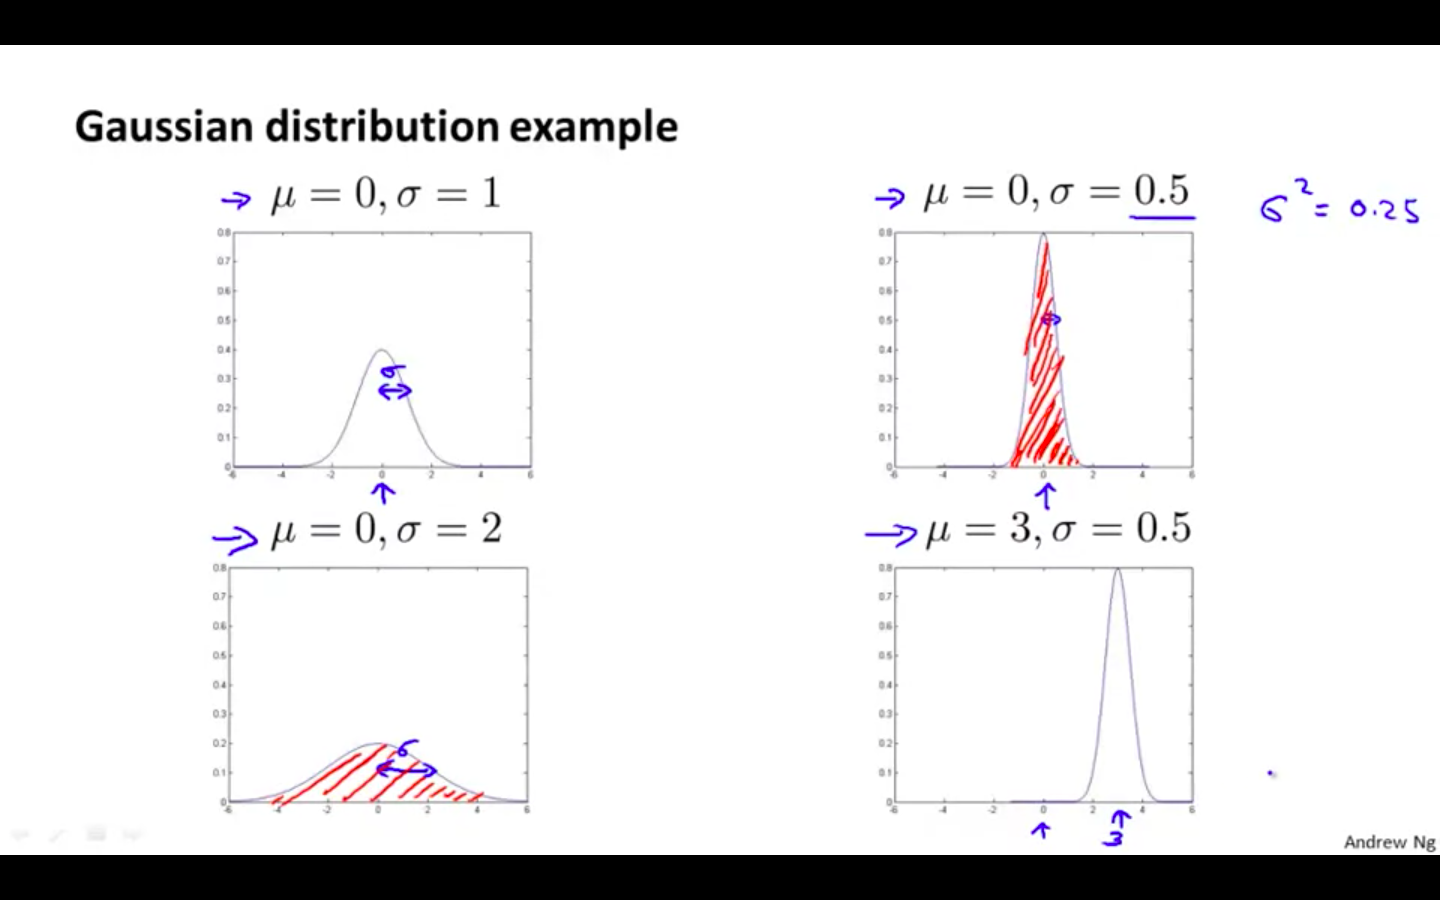
Gaussian Distribution Examples
-
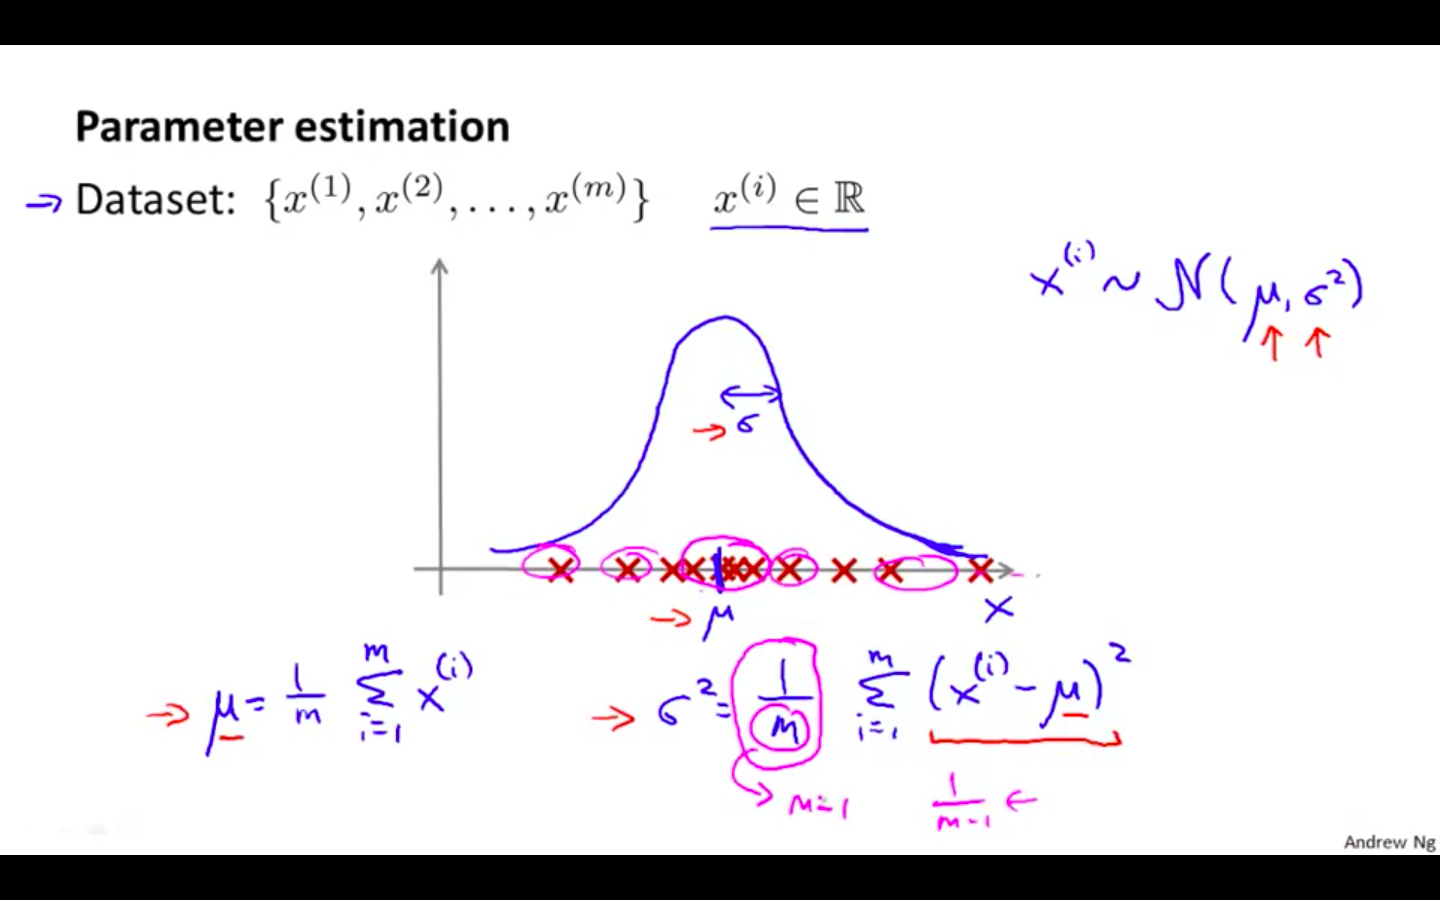
Parameter Estimation
- Finding mean and variance from the Gaussian Distribution
Algorithm
-
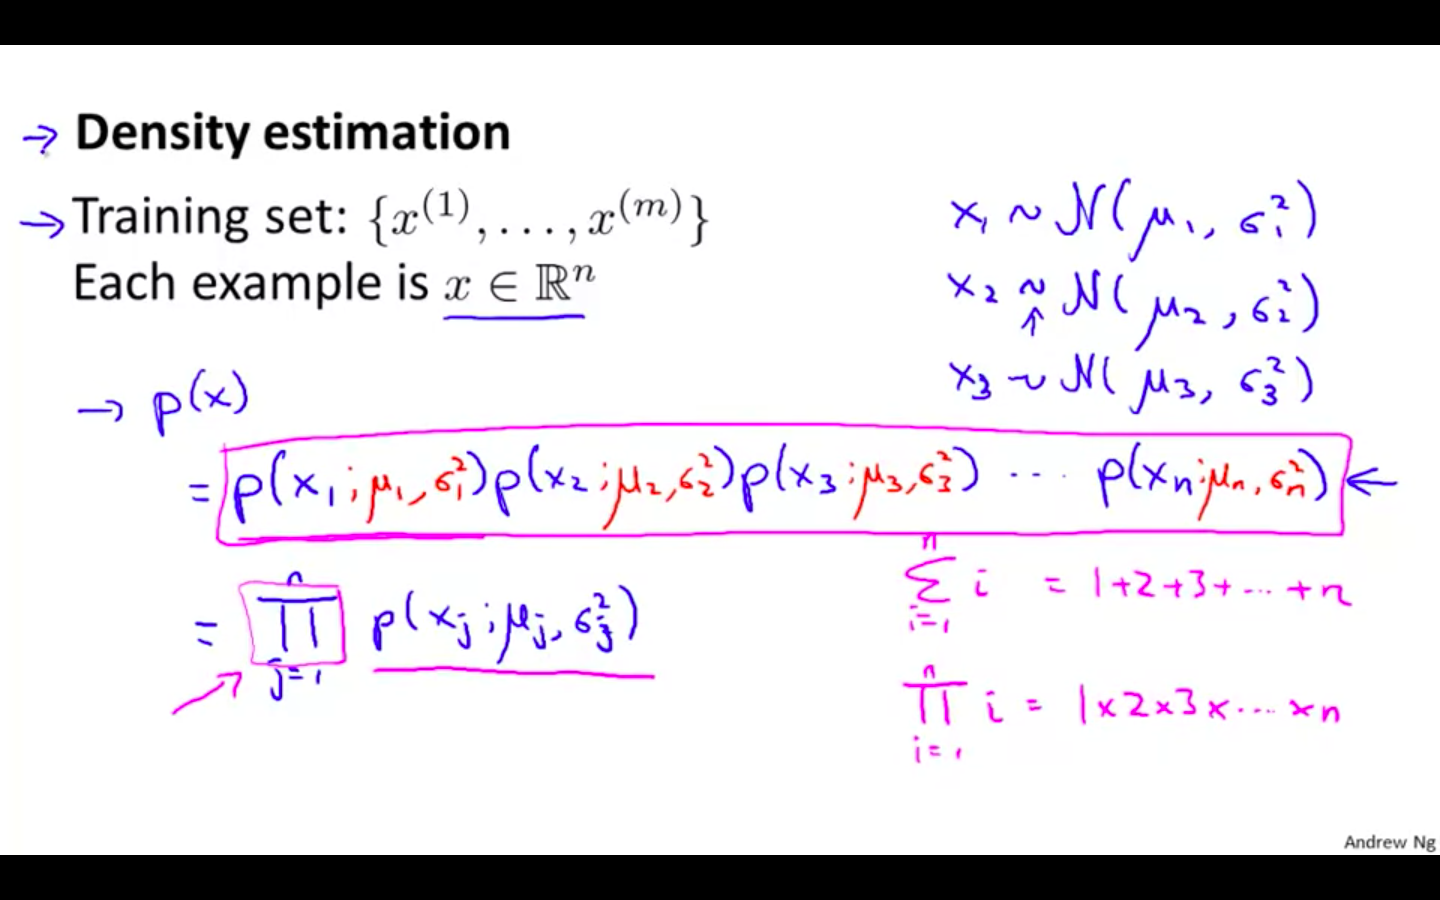
Density Estimation
- Big notation of pi indicates product
-
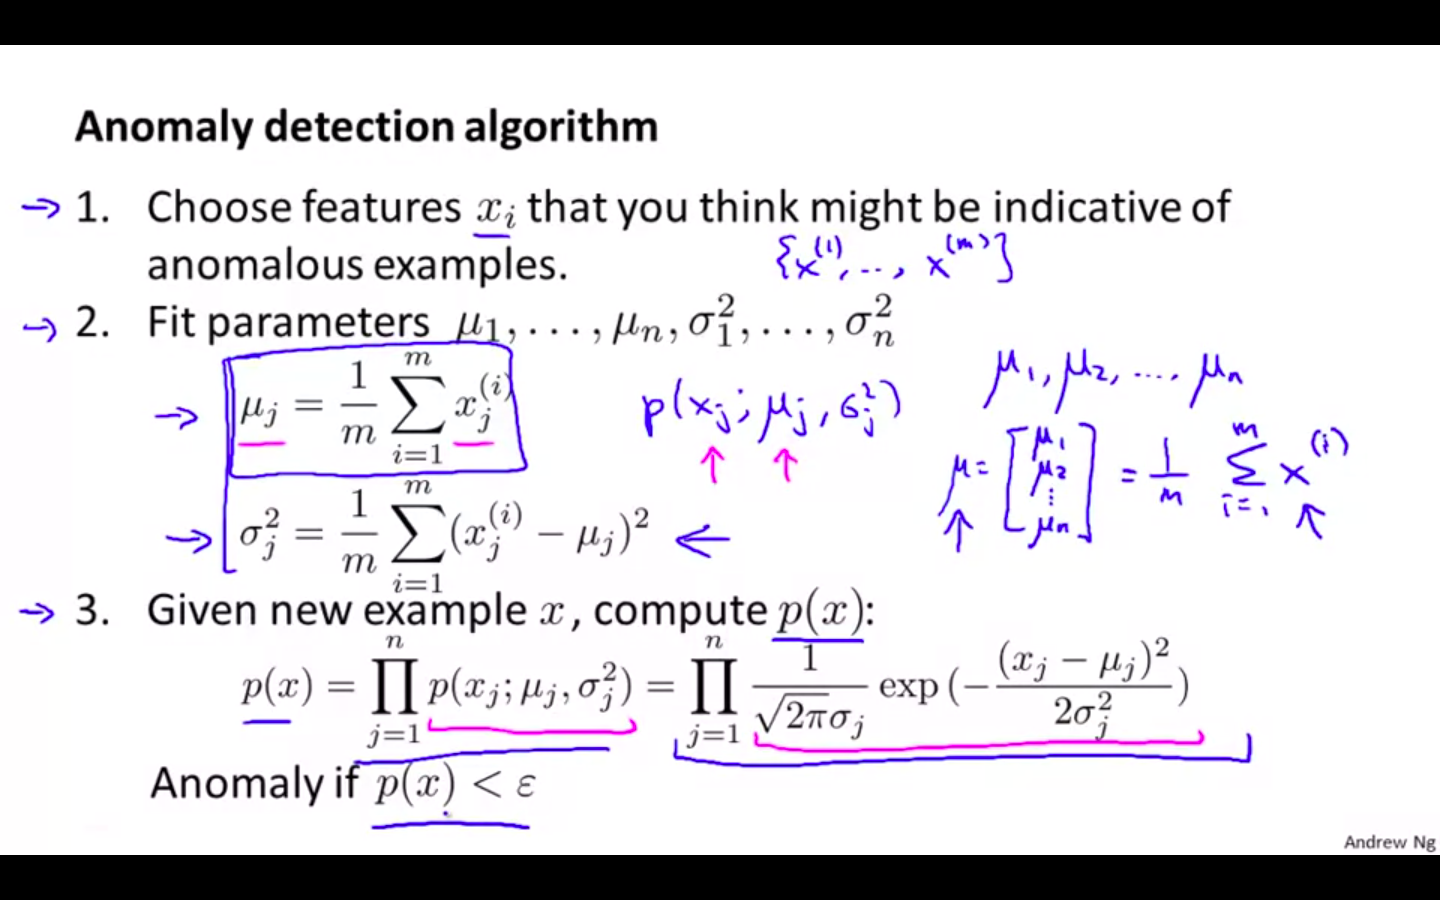
Algorithm
-
Choose features x, that might be indicative of anomalous examples
-
Fit parameters - mean and variance
-
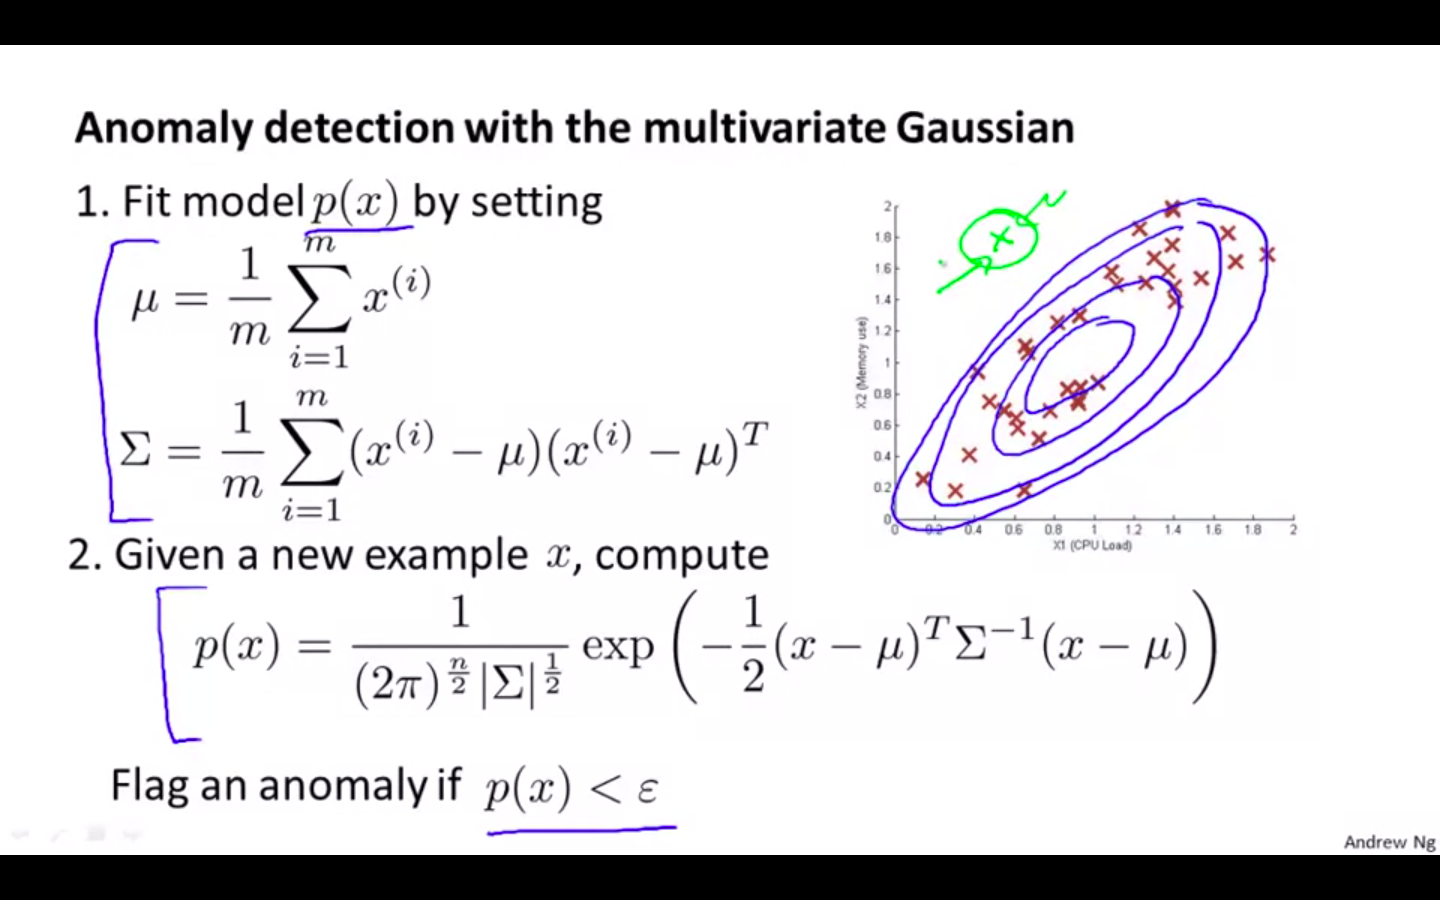
Given new example x, compute p( x )
-
p ( x ) ≥ epsilon ⇒ OK
-
p ( x ) < epsilon ⇒ Anomaly
-
-
Anomaly Detection Example
Building an Anomaly Detection System
Developing and Evaluating an Anomaly Detection System
-
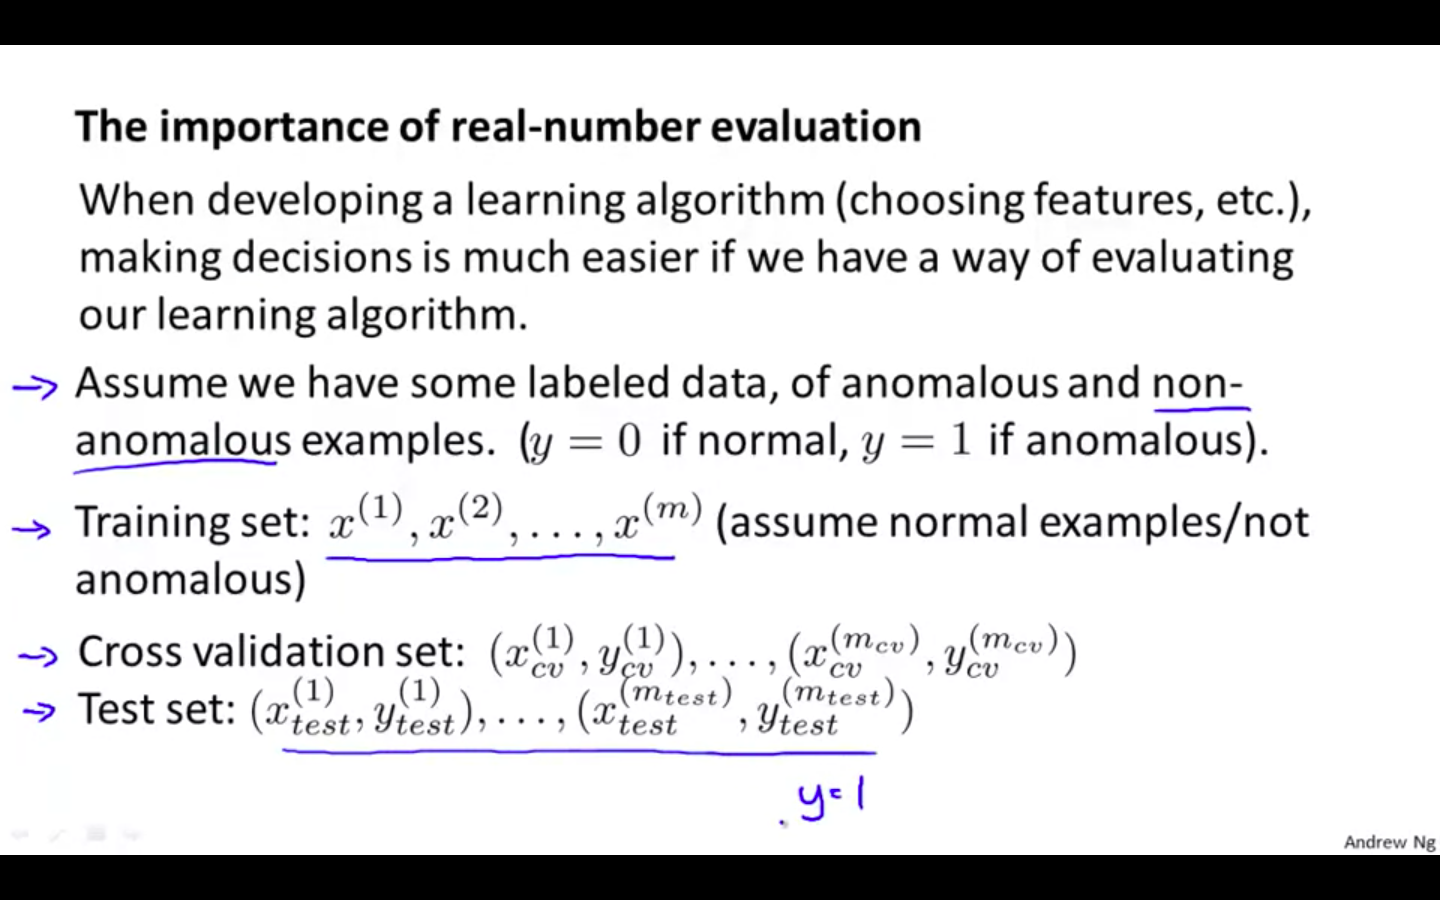
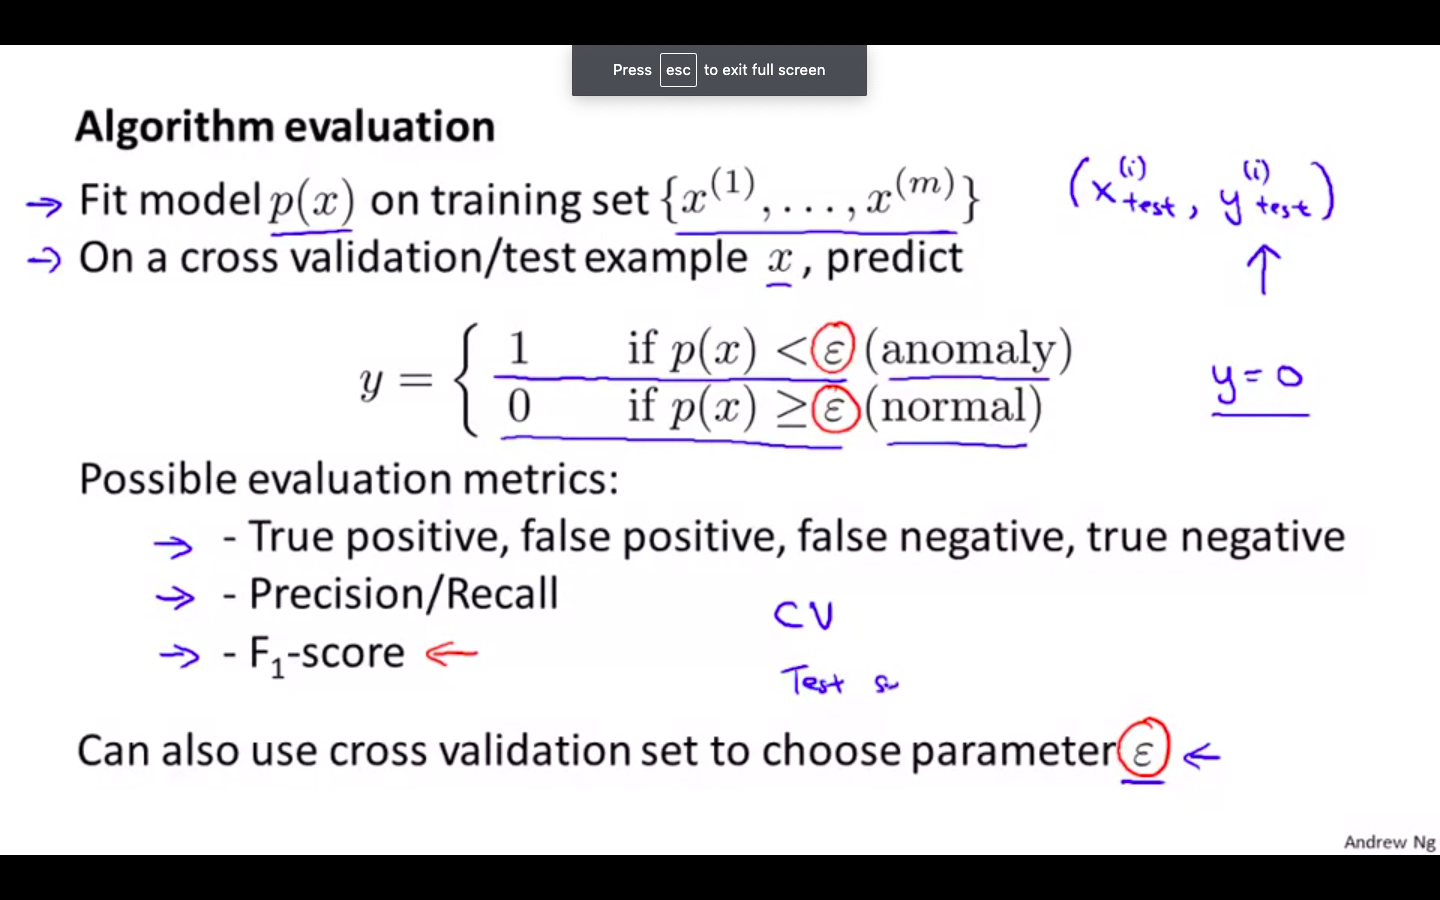
Importance of Real Number Evaluation
- When developing a learning algorithm ( choosing features, etc . ) making decisions is much easier if we have a way of evaluating our learning algorithm
-
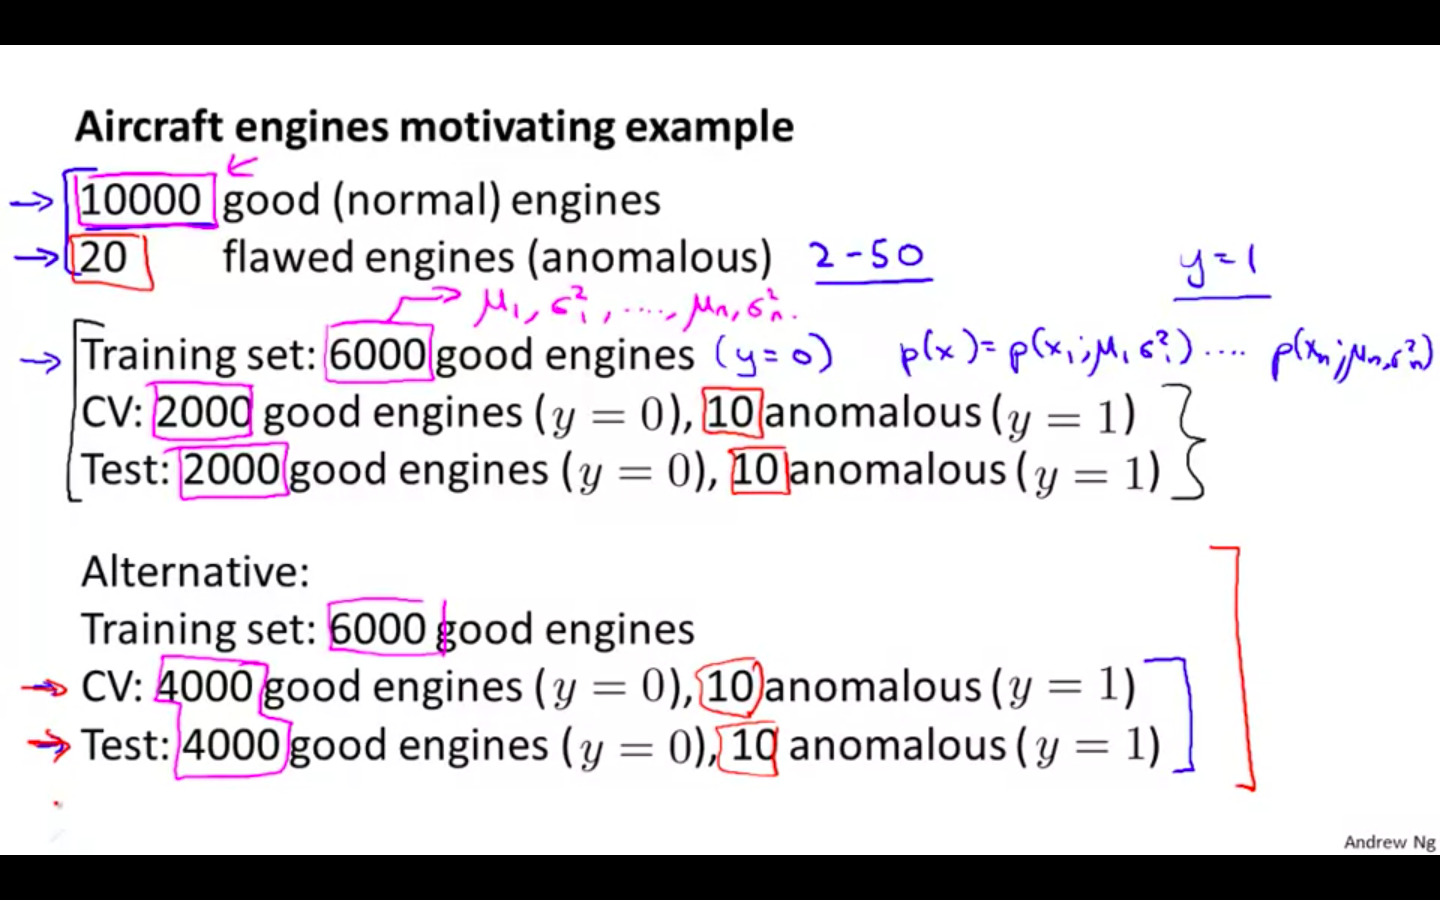
Data Split
- 60 - 20 - 20 data split
-
Evaluation
-
Evaluation metrics
-
True positive, false positive, false negative, true negative
-
Precision / Recall
-
F score
-
-
Use cross validation set to choose parameter epsilon
-
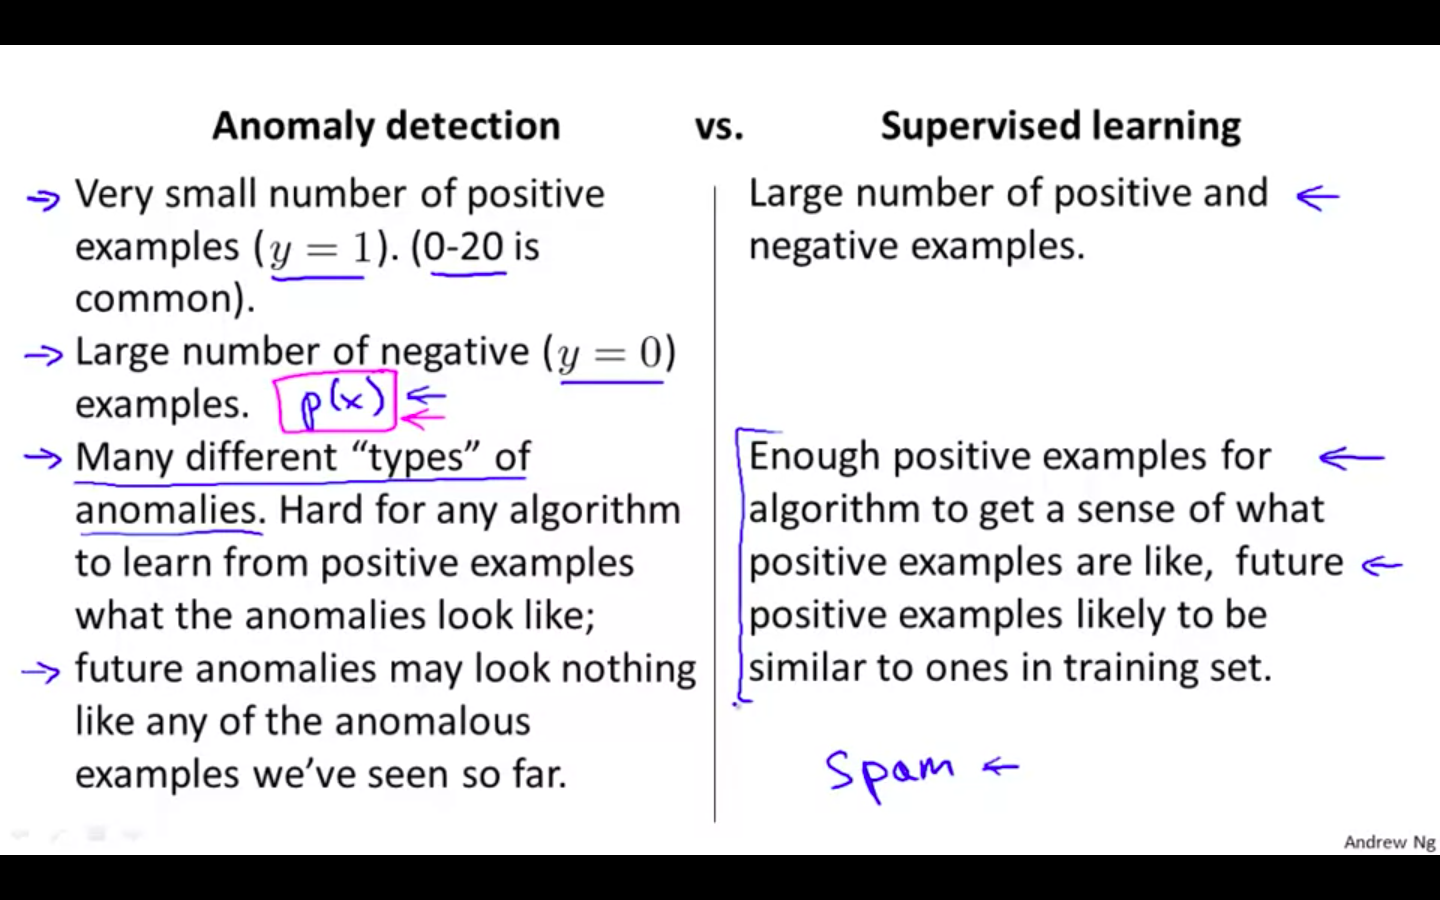
Anomaly Detection vs Supervised Learning
- Anomaly Detection vs Supervised Learning
- Anomaly Detection vs Supervised Learning Examples
Choosing What Features to Use
-
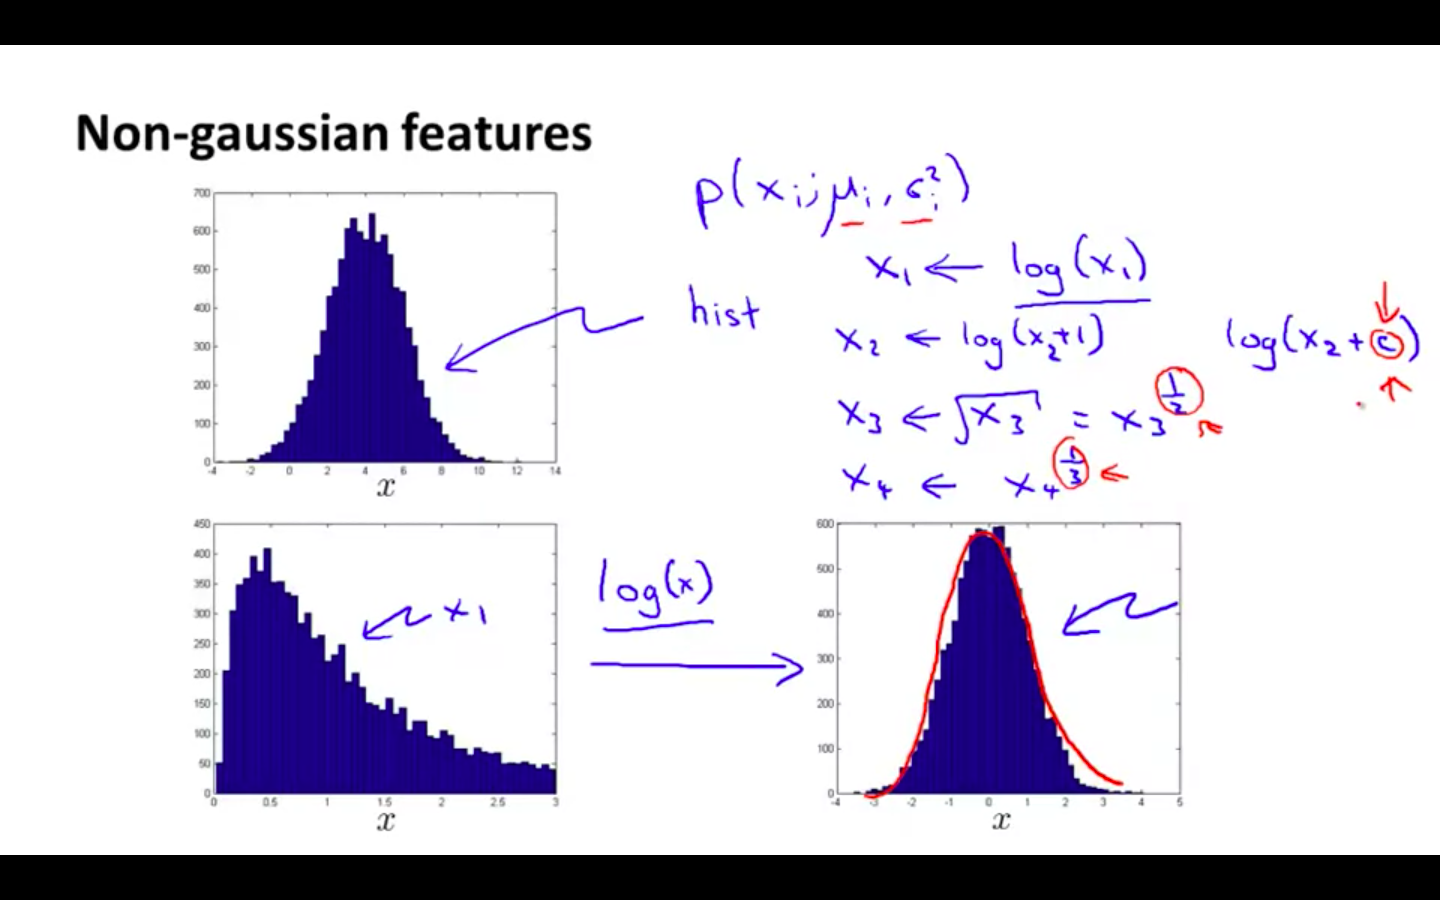
Non Gaussian Features
-
Transform your non gaussian data to the form of gaussian by doing some operations on it and then feed it to the algorithm
-
It will work even if its not transformed, but it will gives less performance
-
-
Error Analysis
- Find new features by analysing the mistake done by the algorithm in flagging anomaly
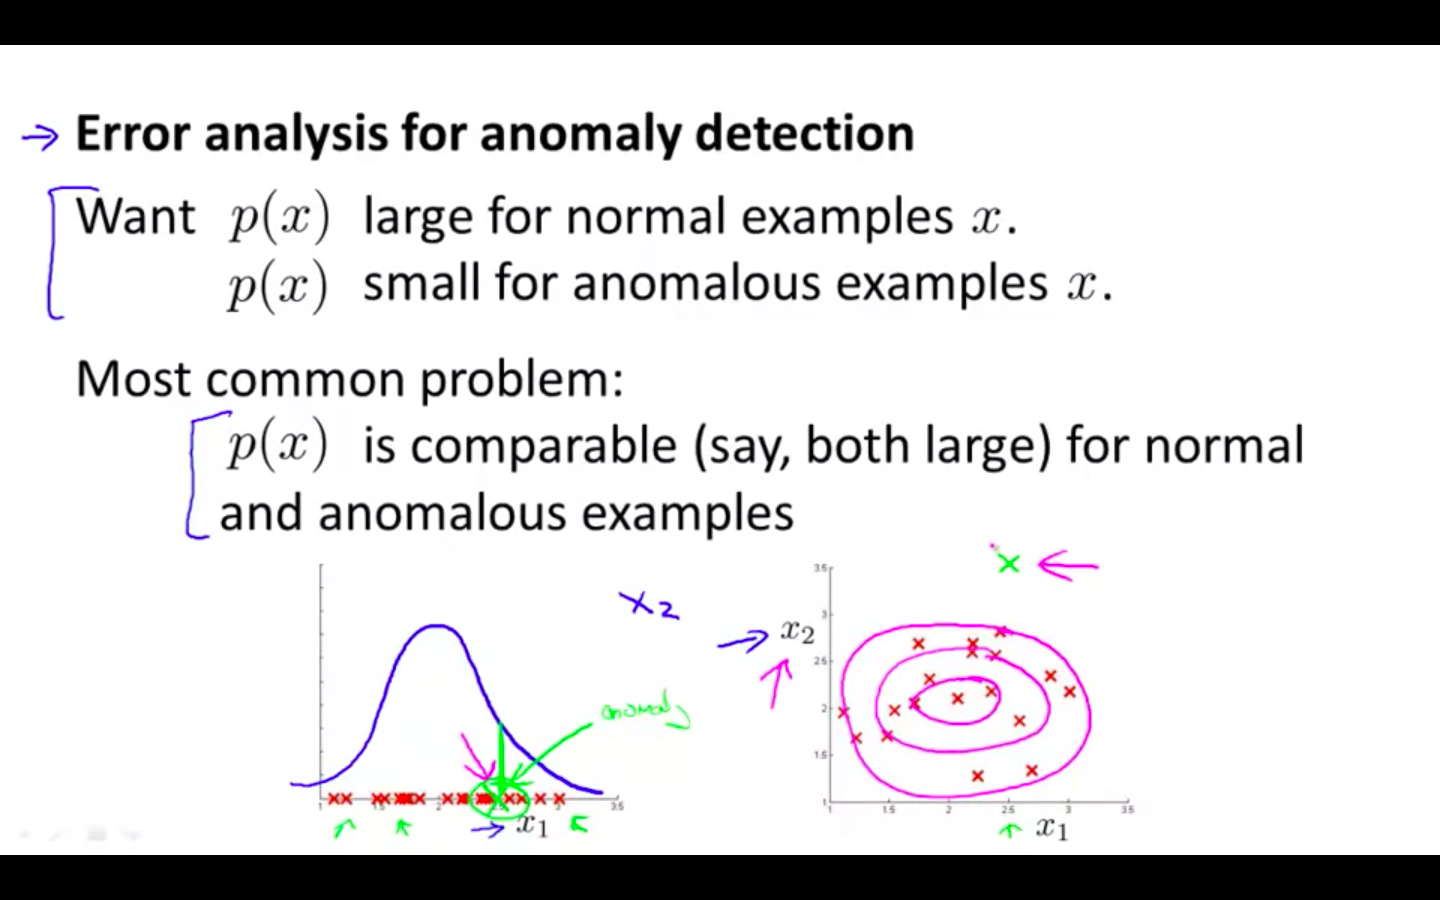
-
Example
-
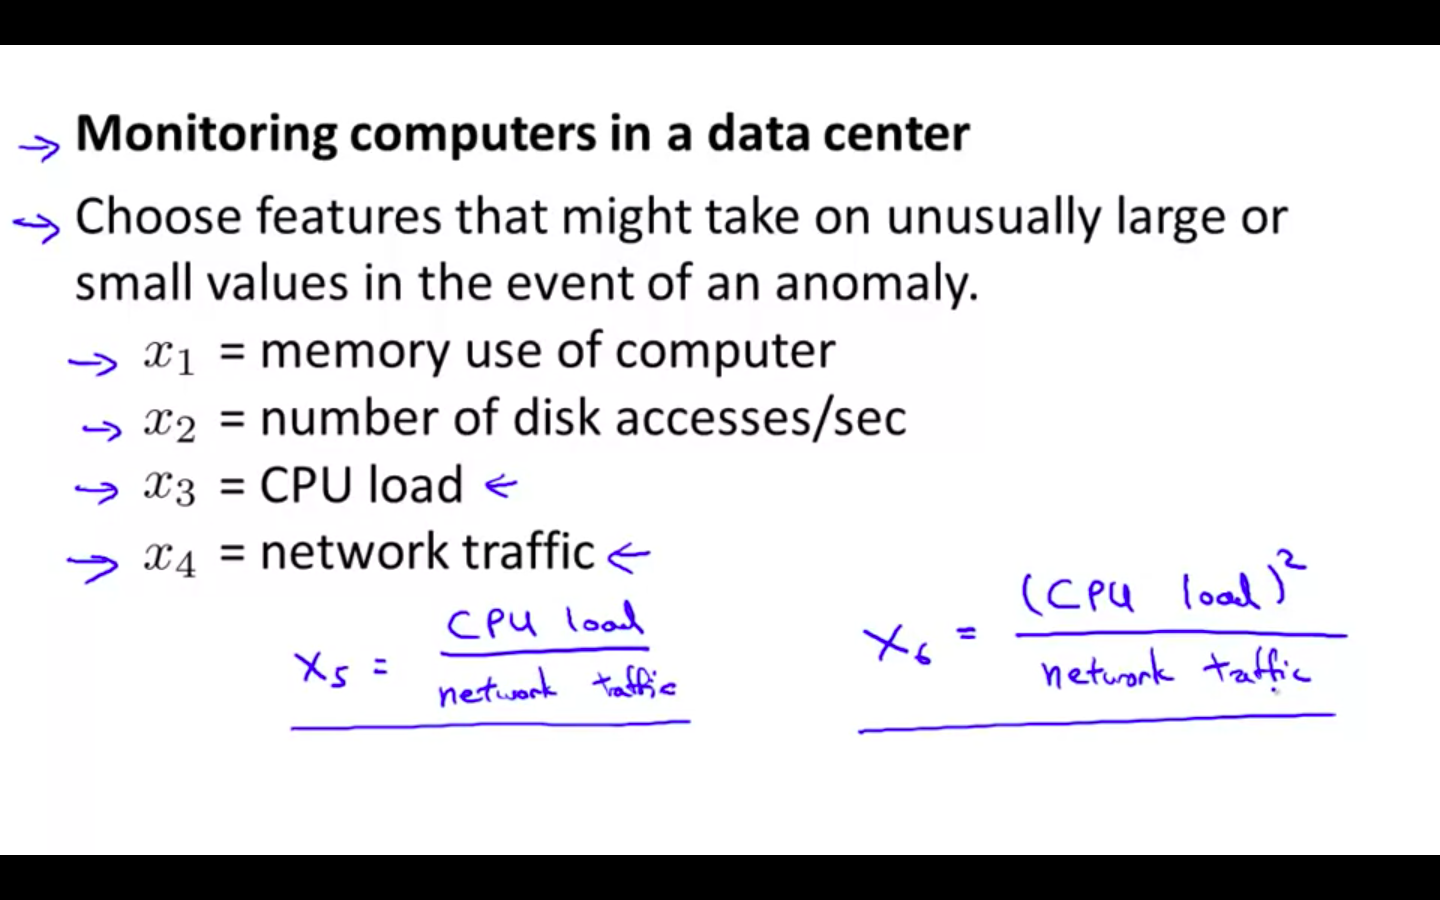
Monitoring computers in a data center
-
Choose features that might take on unusually large or small values in the event of anomaly
-
x1 = memory use of computer
-
x2 = number of disk accesses / sec
-
x3 = CPU load
-
x4 = network traffic
-
x5 = CPU load / network traffic ( new feature )
-
-
Multivariate Gaussian Distribution
Multivariate Gaussian Distribution
-
Motivating Example
- Monitoring machines in a data center
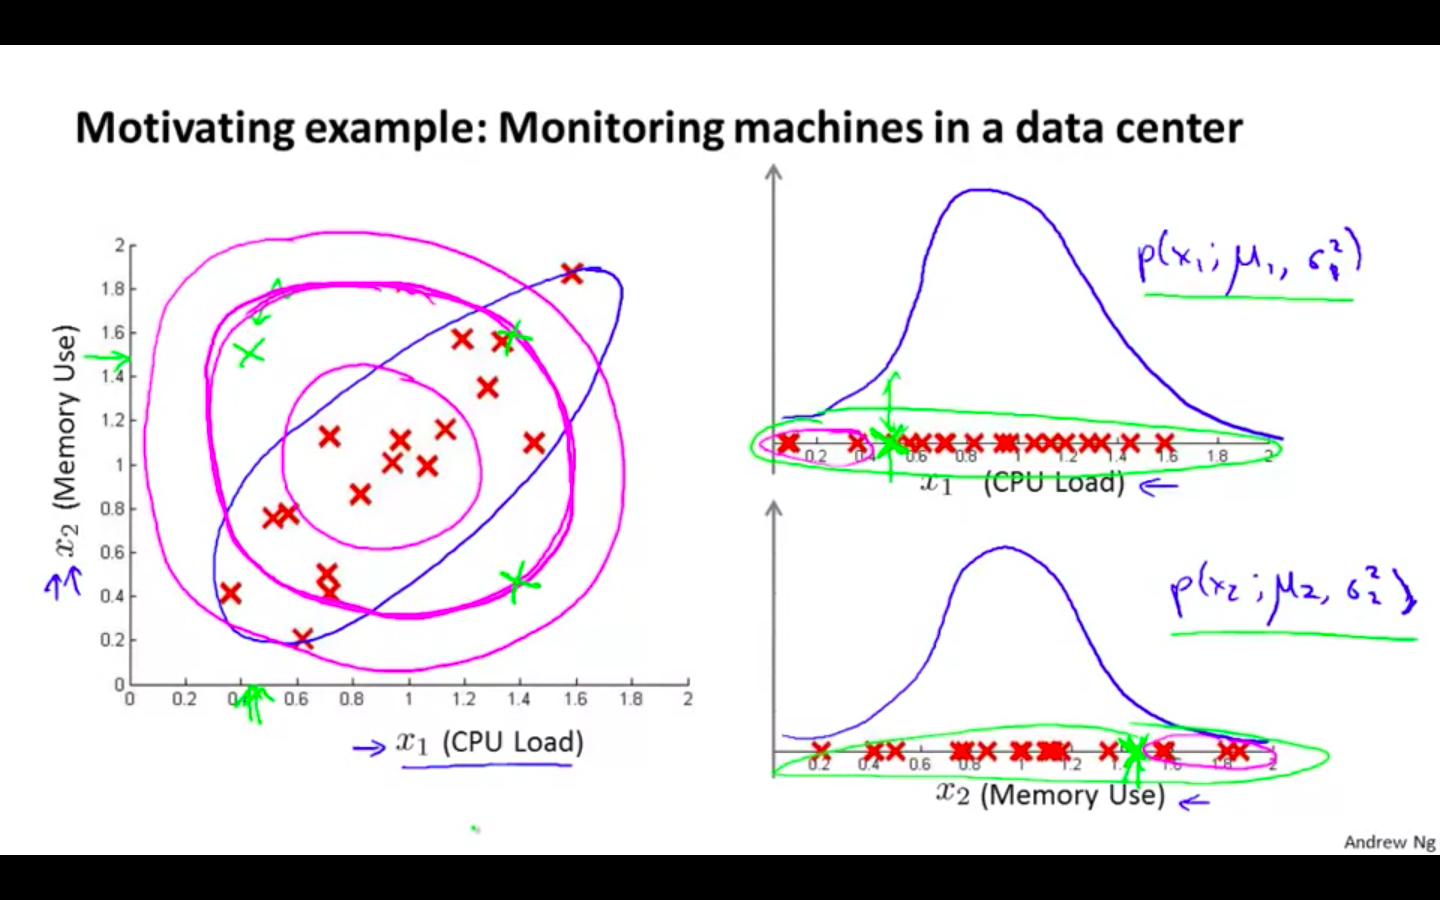
-
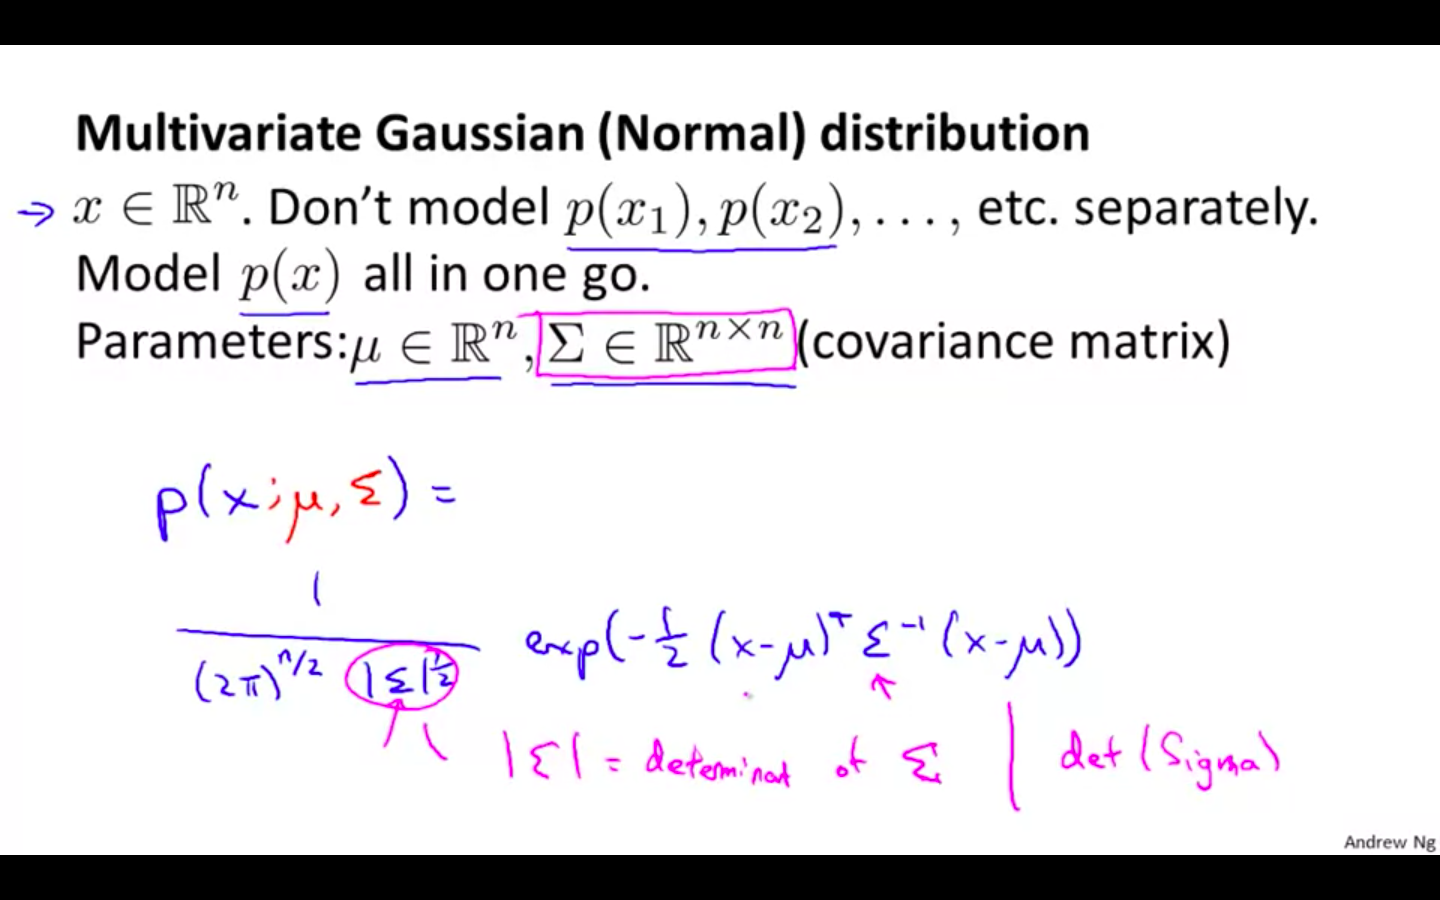
Multivariate Gaussian Distribution
-
x belongs to real number
-
Don’t model p ( x1 ), p ( x2 ) …. separately.
-
Model p ( x ) all in one go
-
Parameters: mean, covariance matrix
-
-
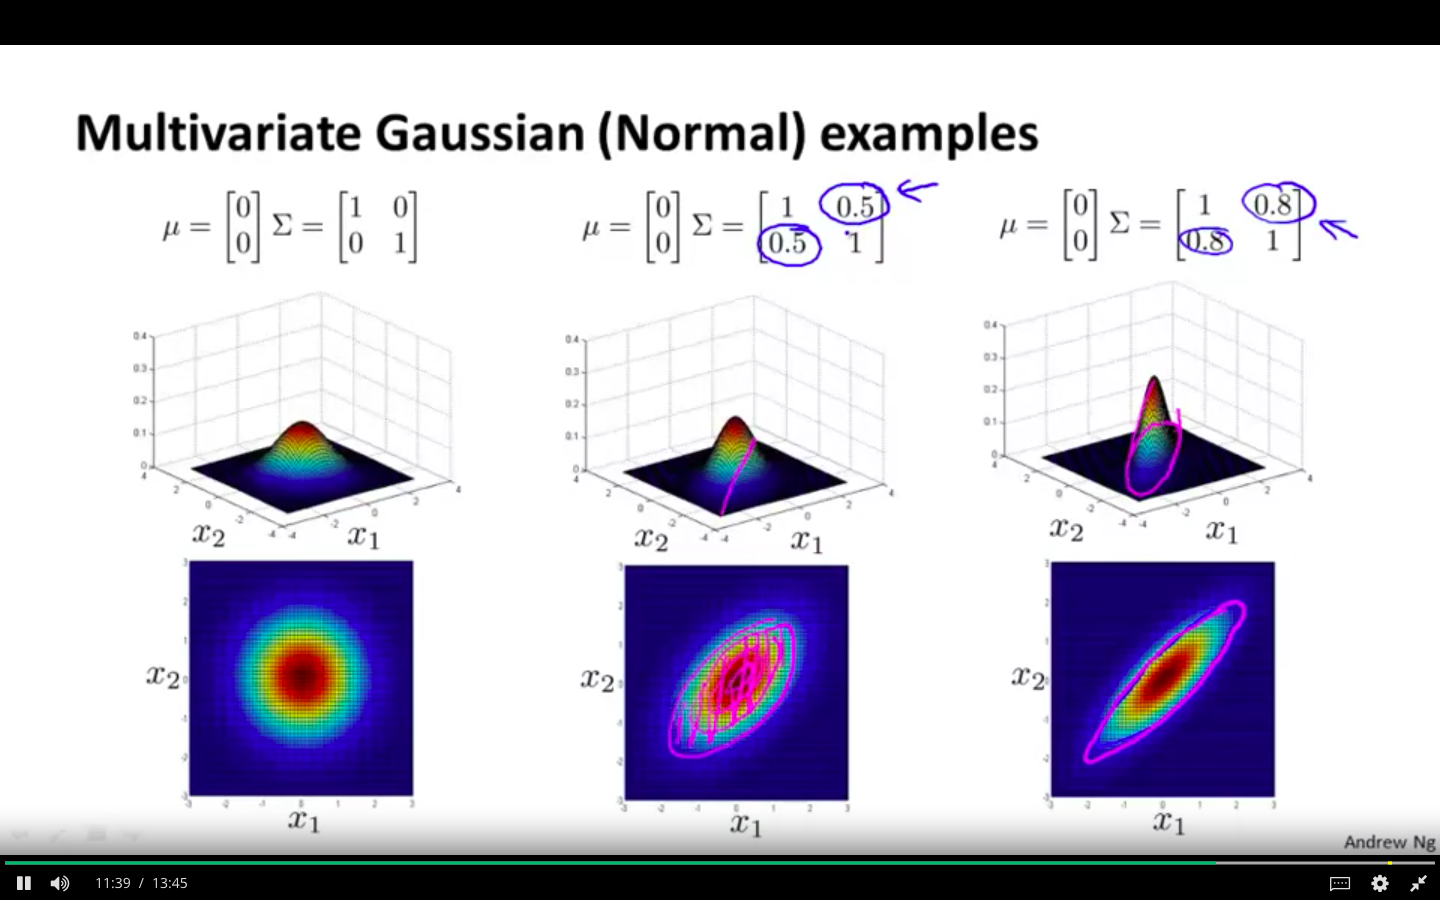
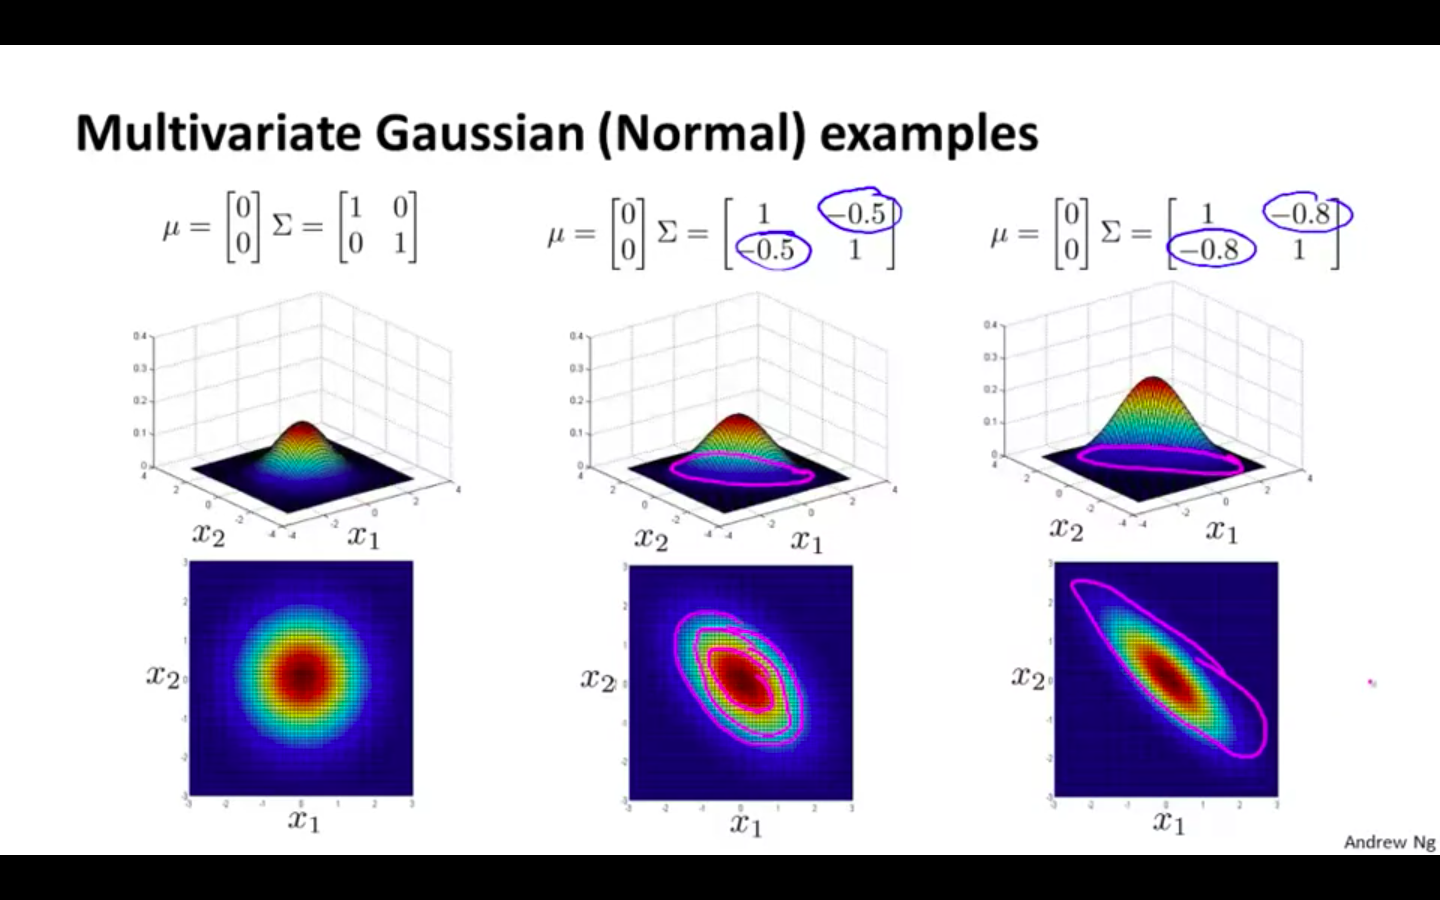
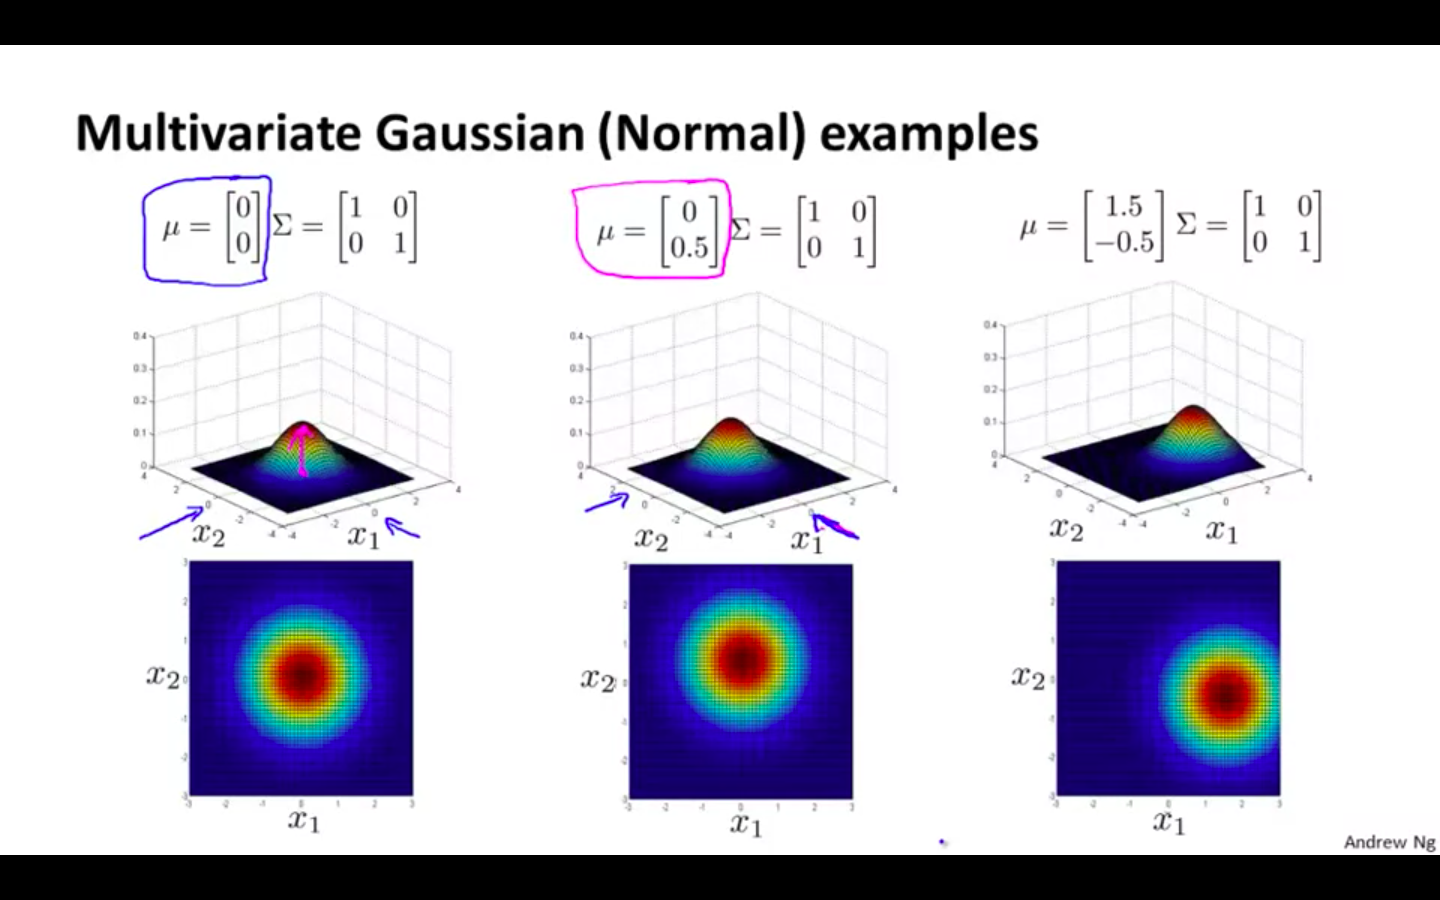
Multivariate Gaussian Distribution Examples
-
Covariance matrix is altered
-
Only the first diagonal
-
Even alteration
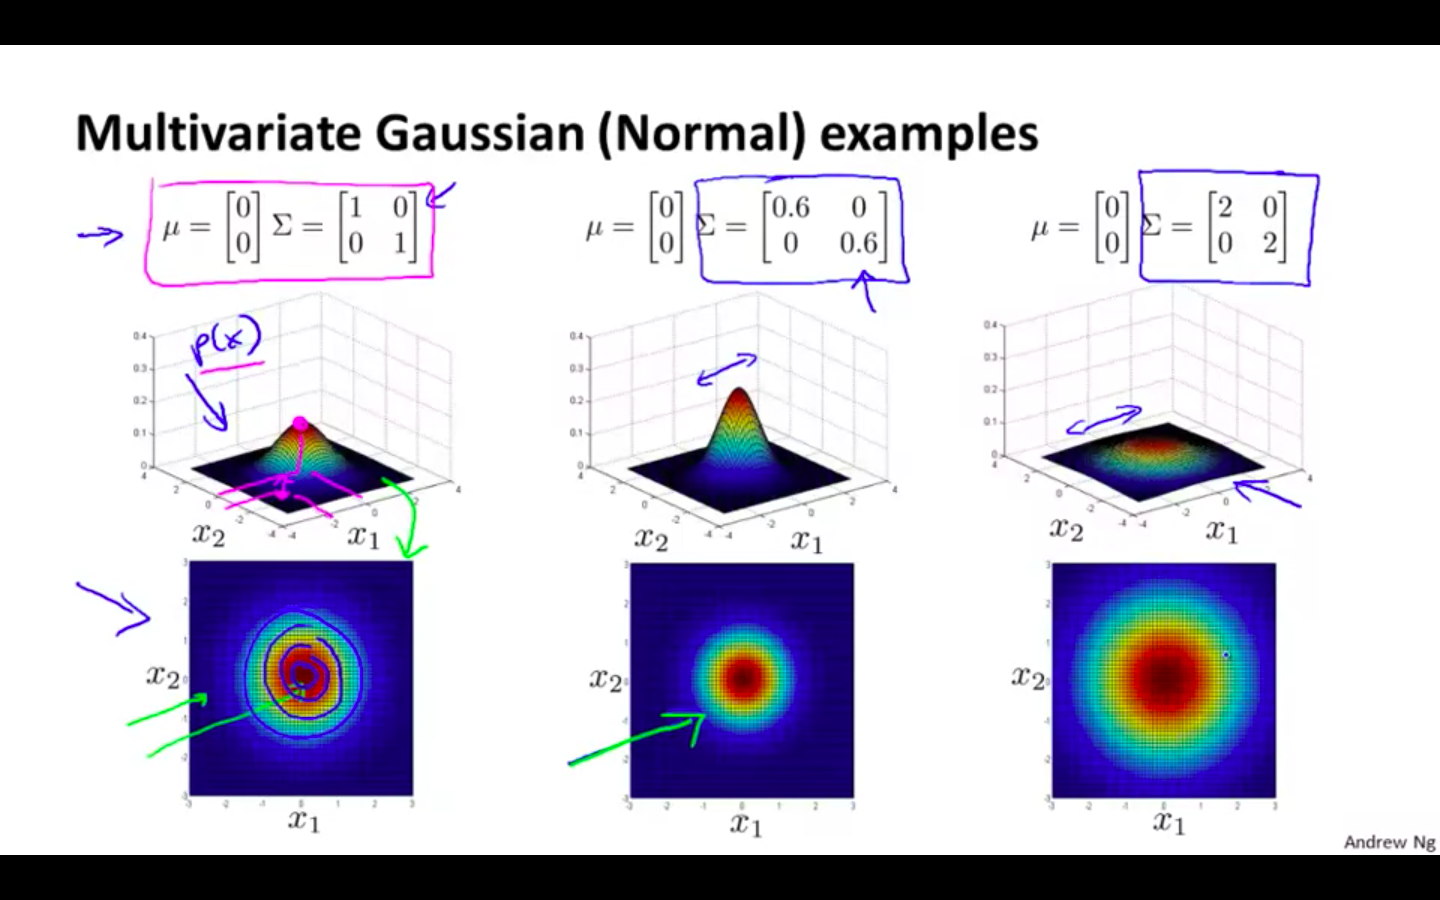
- Uneven alteration
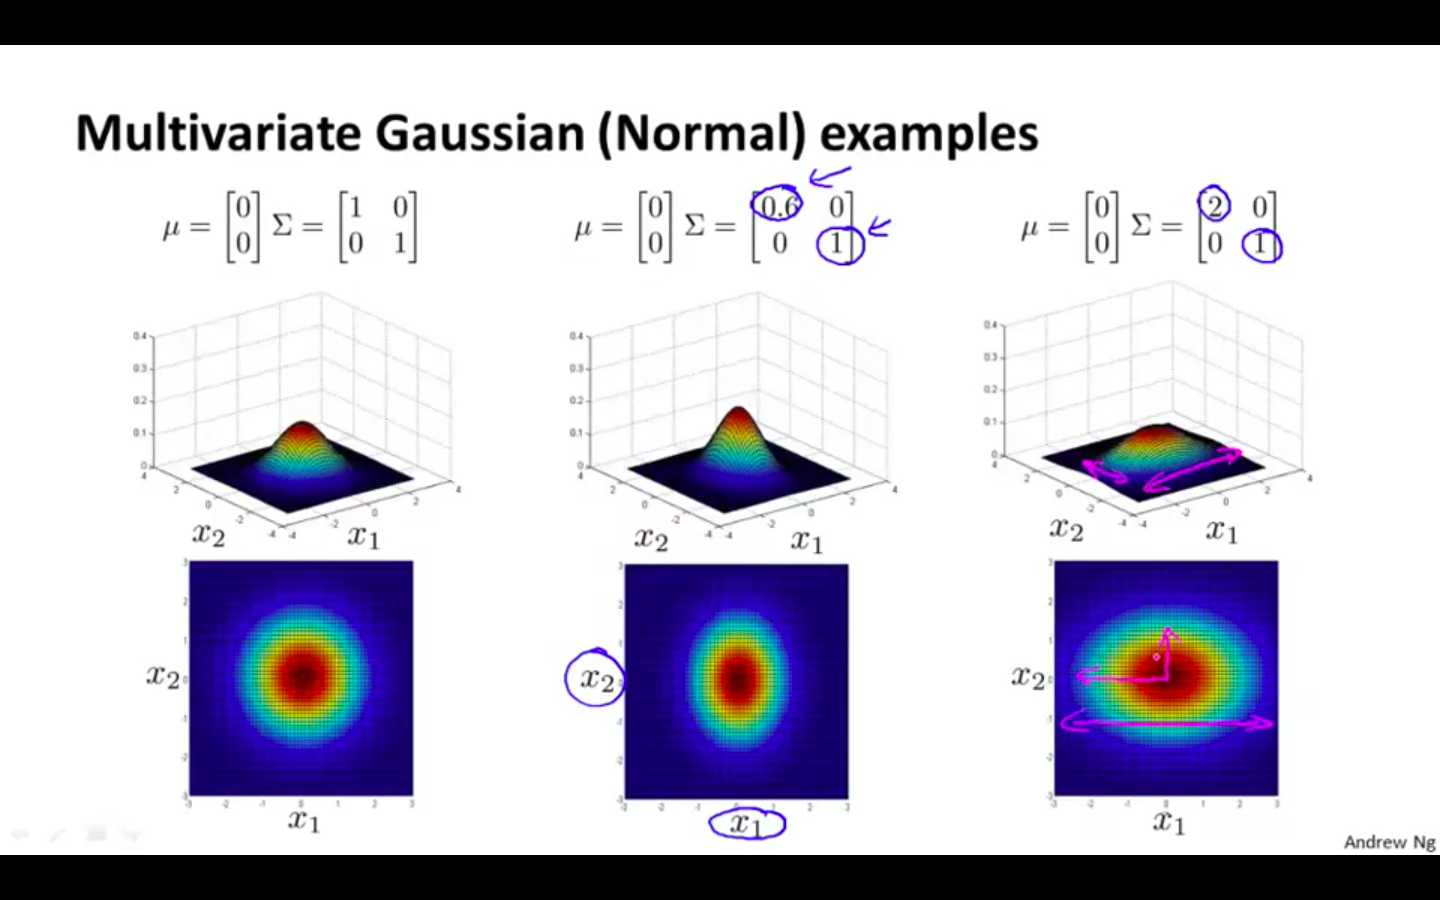
- Altering second diagonal evenly
- Altering second diagonal values negatively
- Altering the mean value
-
Anomaly Detection using the Multivariate Gaussian Distribution
-
Multivariate Gaussian Distribution
-
Formula
- Finding the parameters with the formula
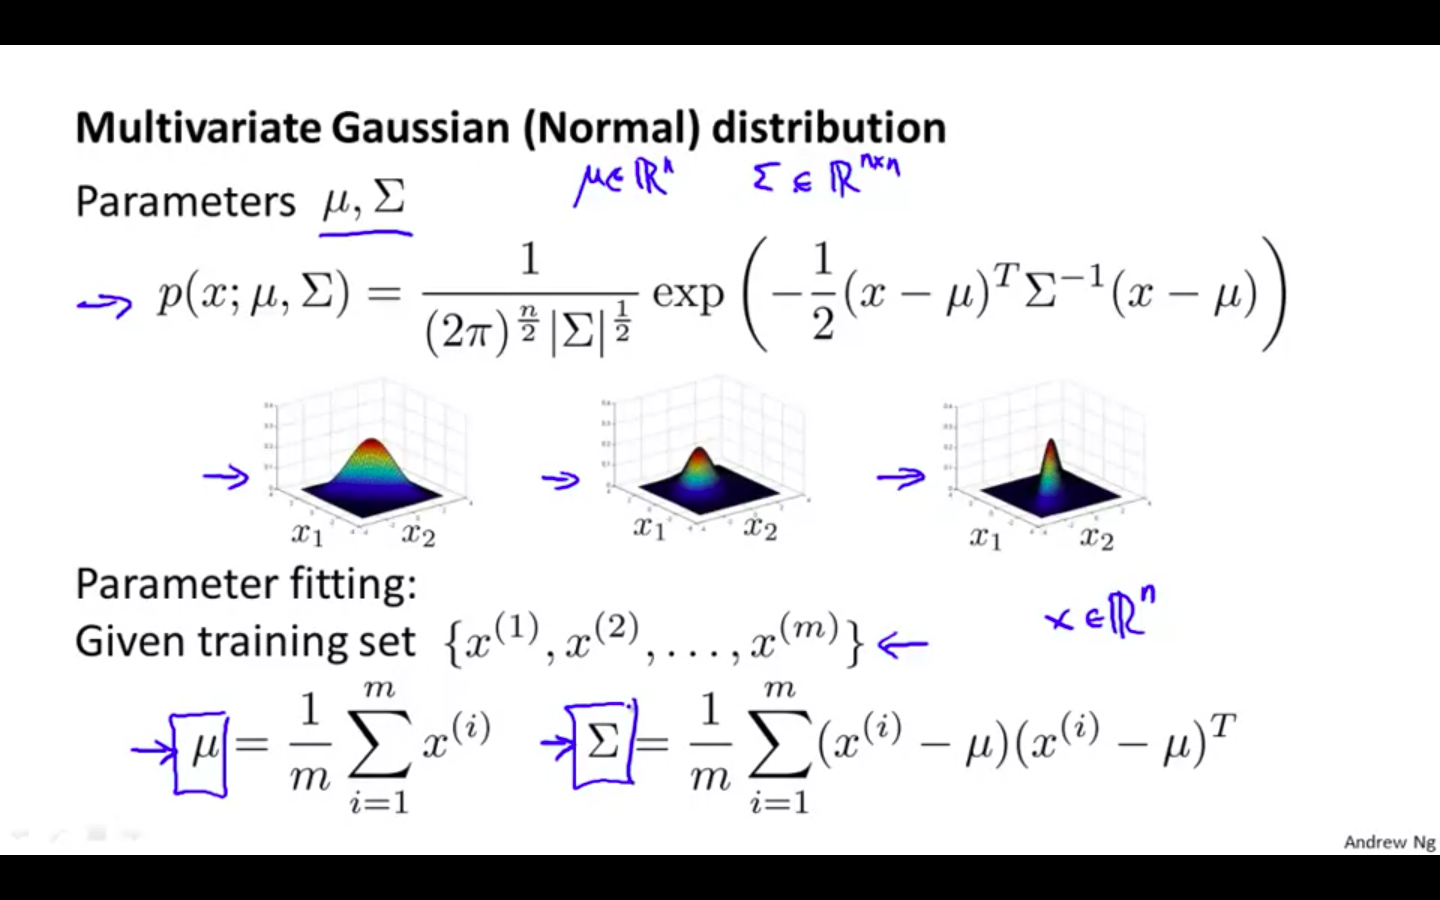
-
Flow
- Substituting the values of parameters in the formula
-
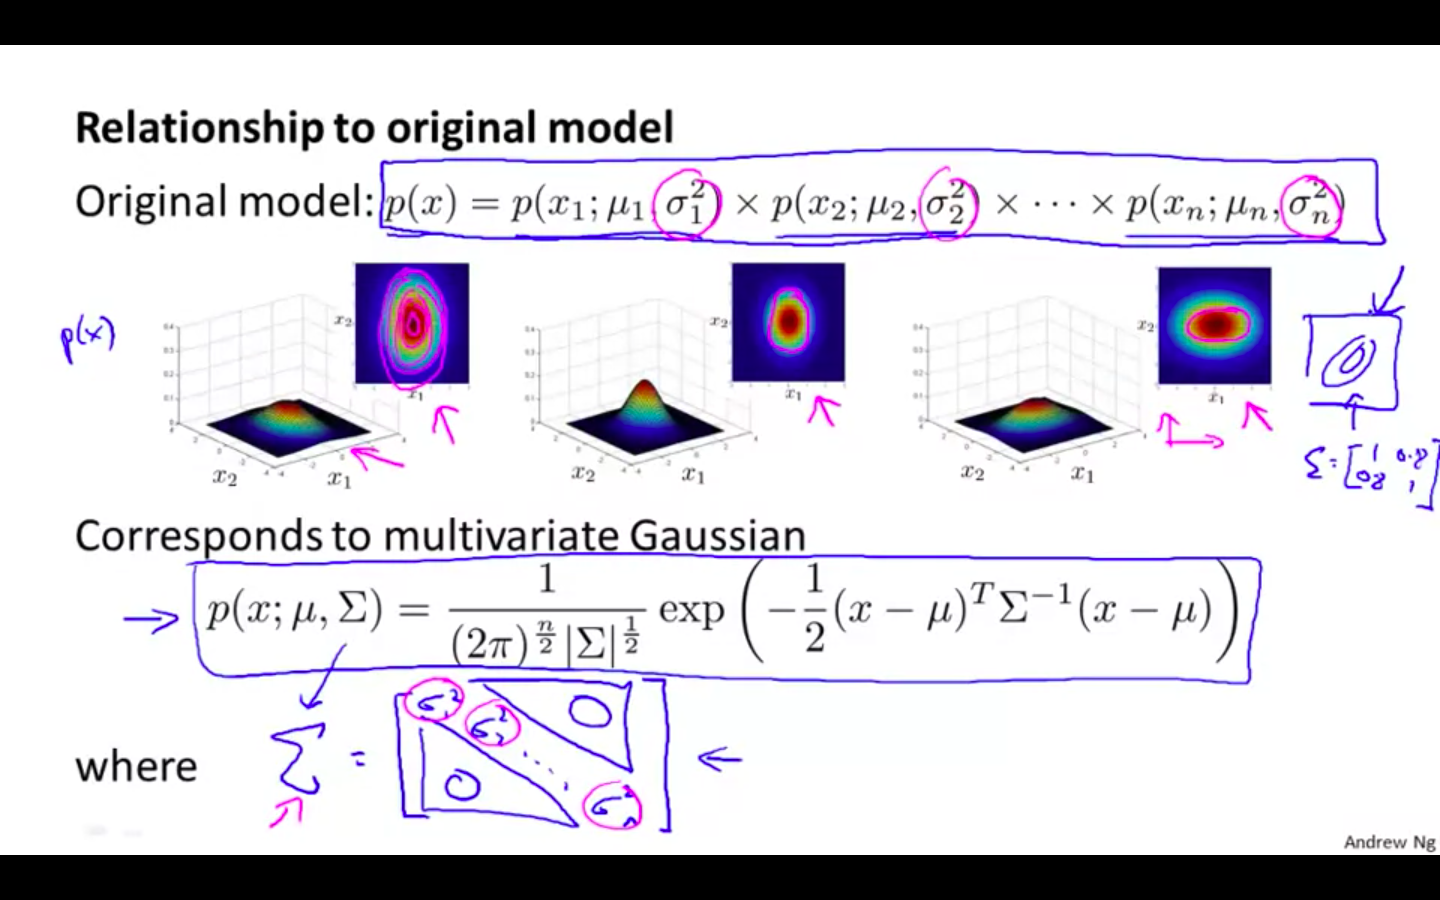
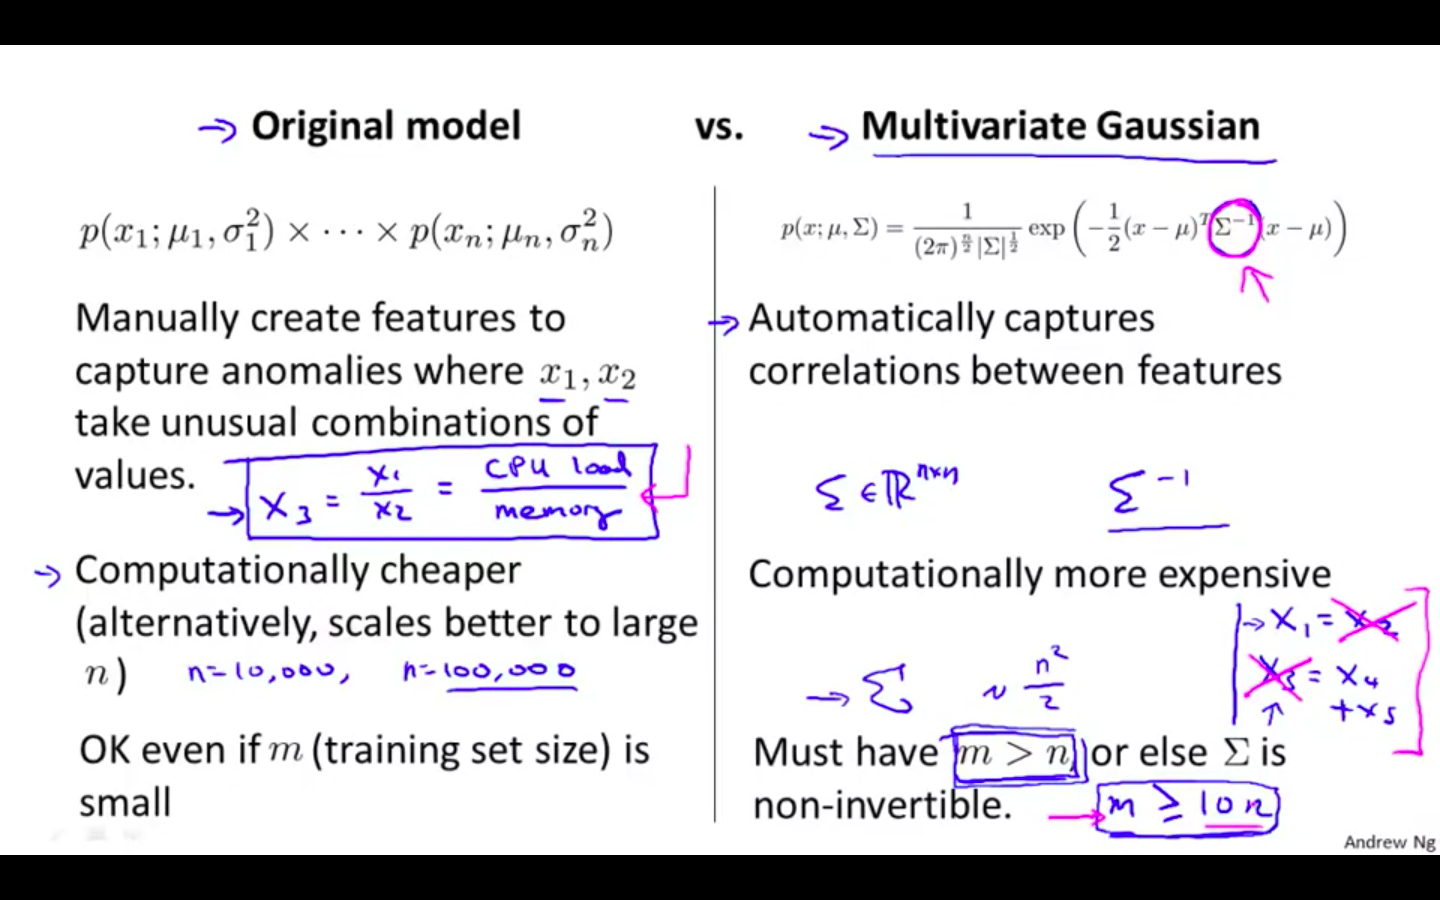
Relationship to the original model
- It can proved as the special case of the multivariate gaussian distribution where it aligned with the axis
-
-
Differentiation
- Original Model vs Multivariate Gaussian
Predicting Movie Ratings
Problem Formulation
-
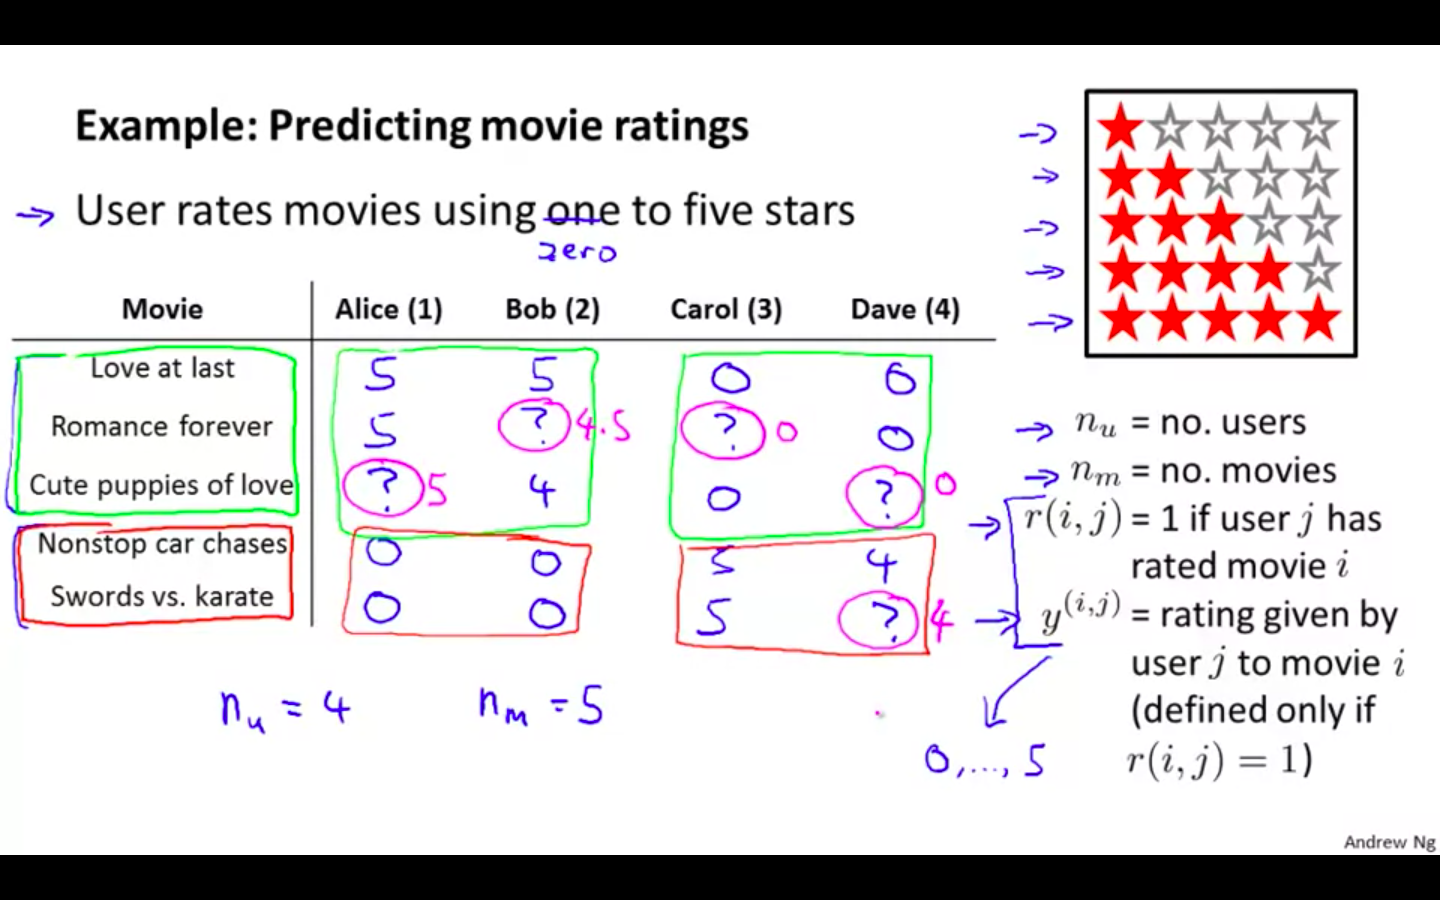
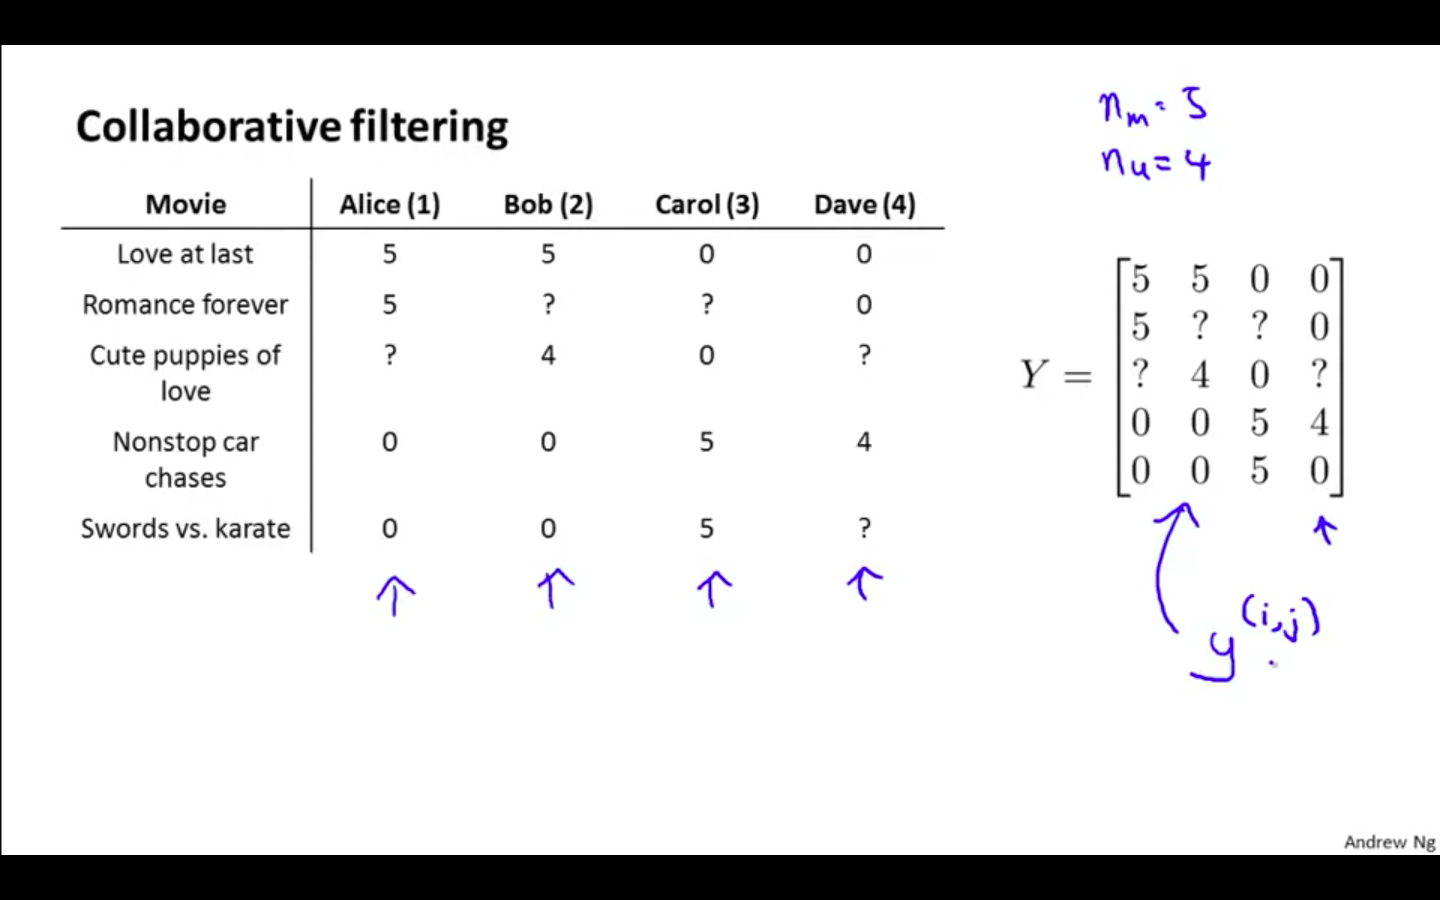
Example
-
Predicting Movie Rating
-
n_u ⇒ no. of users
-
n_m ⇒ no. of movies
-
r ( i , j ) = 1 ⇒if user j has rated movie i
-
y ^ ( i , j ) ⇒ rating given by the user j to movie i ( defined only if r ( i , j ) = 1 )
-
-
Content Based Recommendations
-
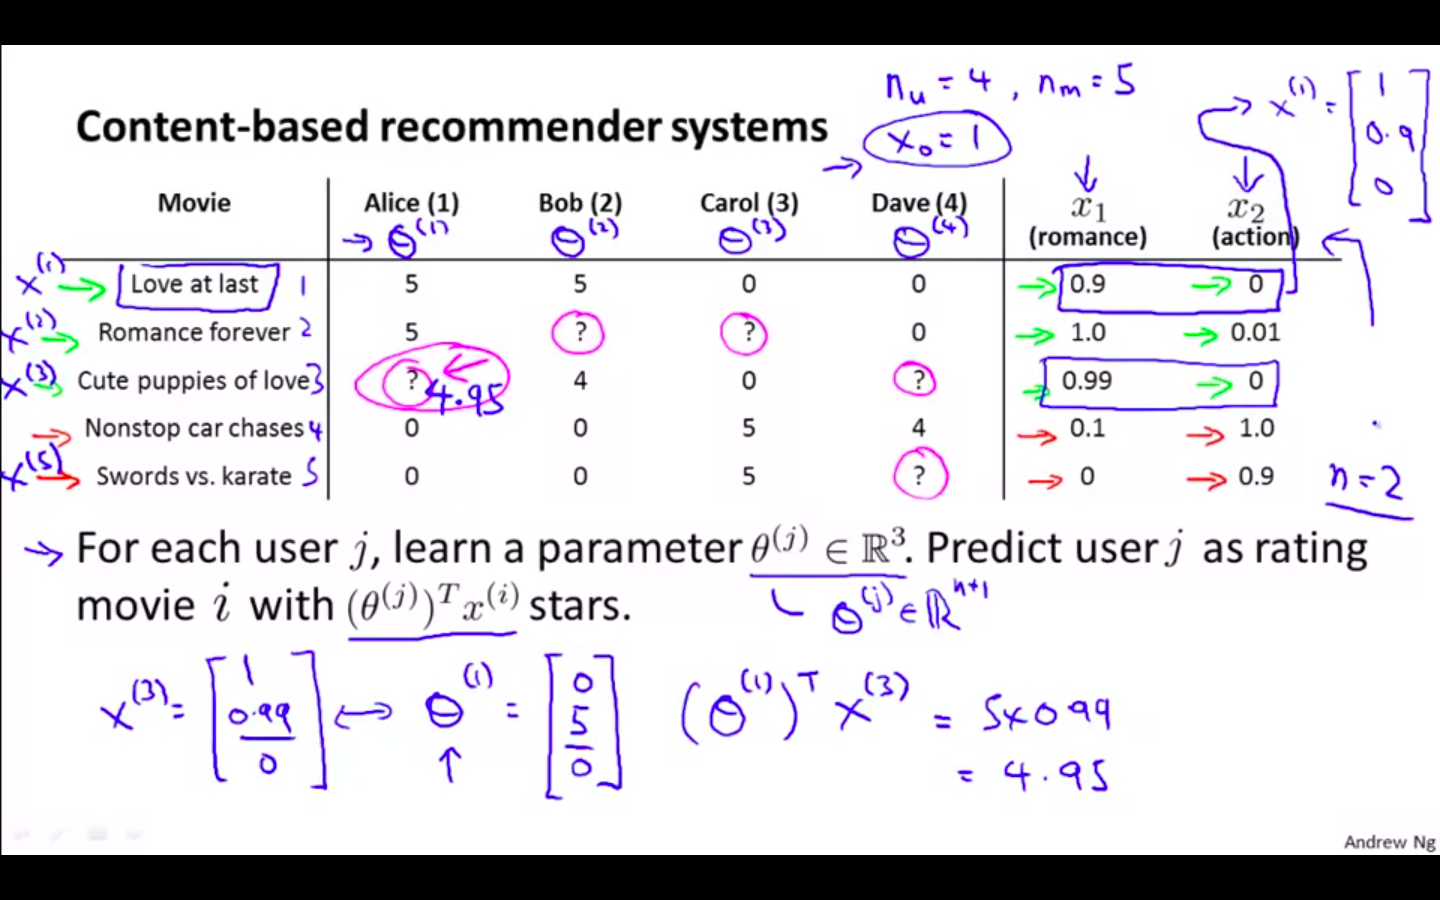
Content Based Recommender System
- This is recommender system which uses one form of linear regression
-
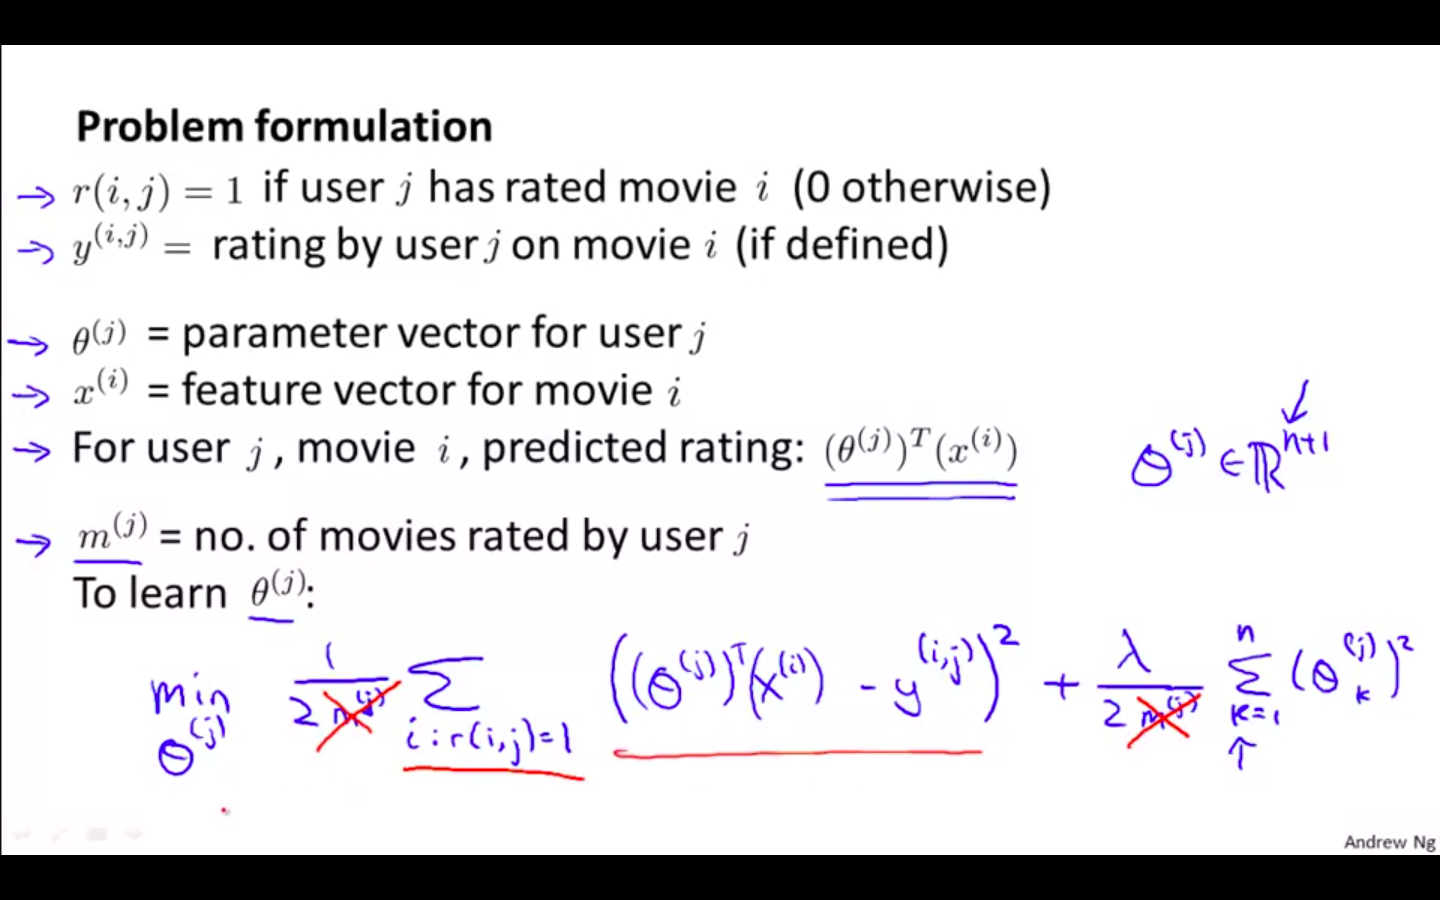
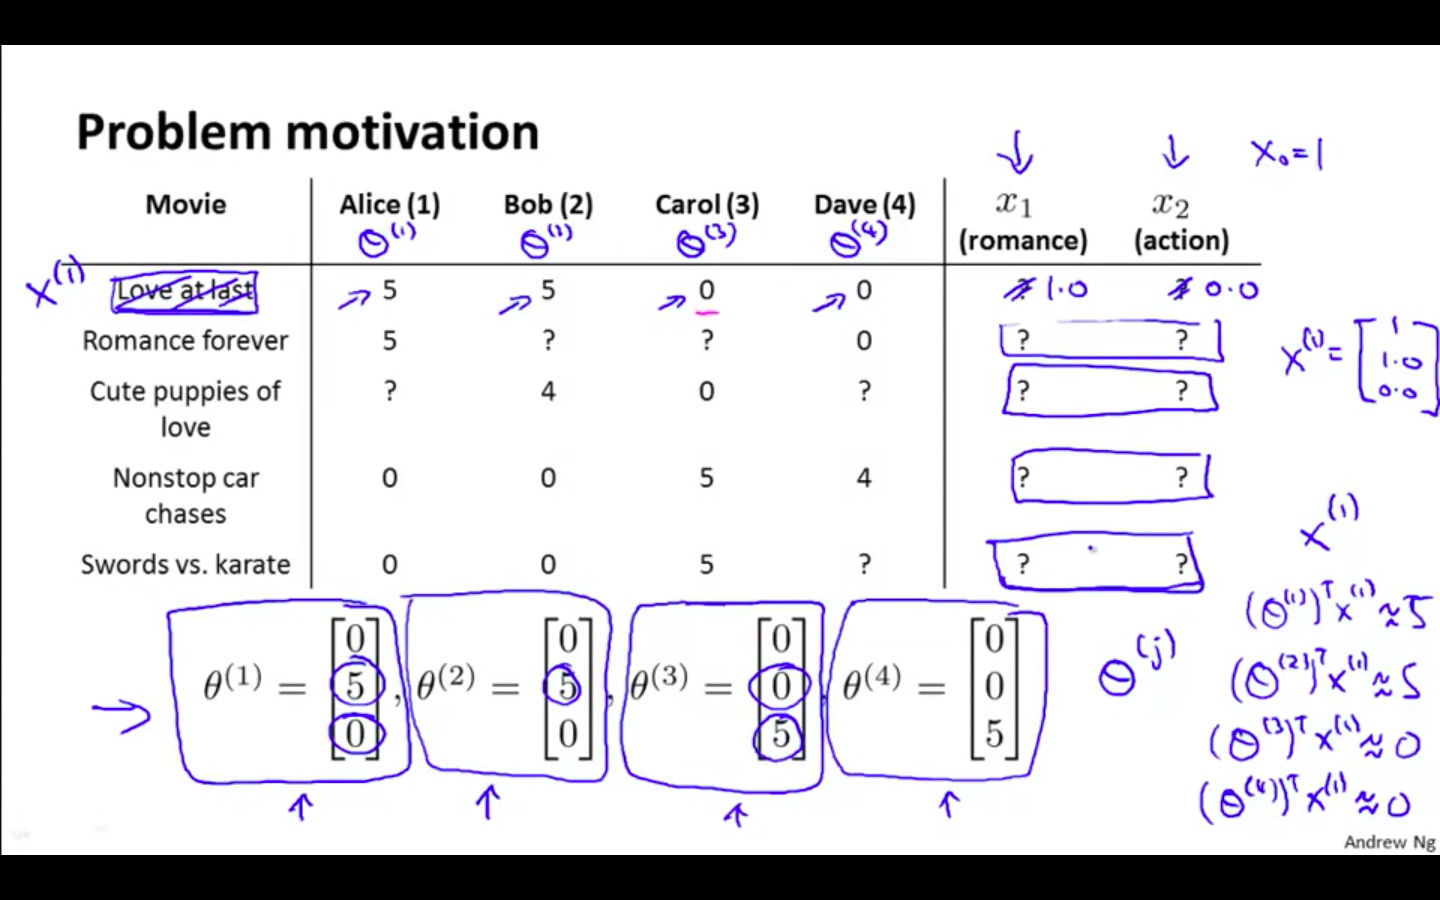
Problem Formulation
-
r ( i , j ) = 1 ⇒if user j has rated movie i
-
y ^ ( i , j ) ⇒ rating given by the user j to movie i ( defined only if r ( i , j ) = 1 )
-
theta^j ⇒ parameter vector for user j
-
x ^ i ⇒ feature vector for movie i
-
-
Optimisation Objective
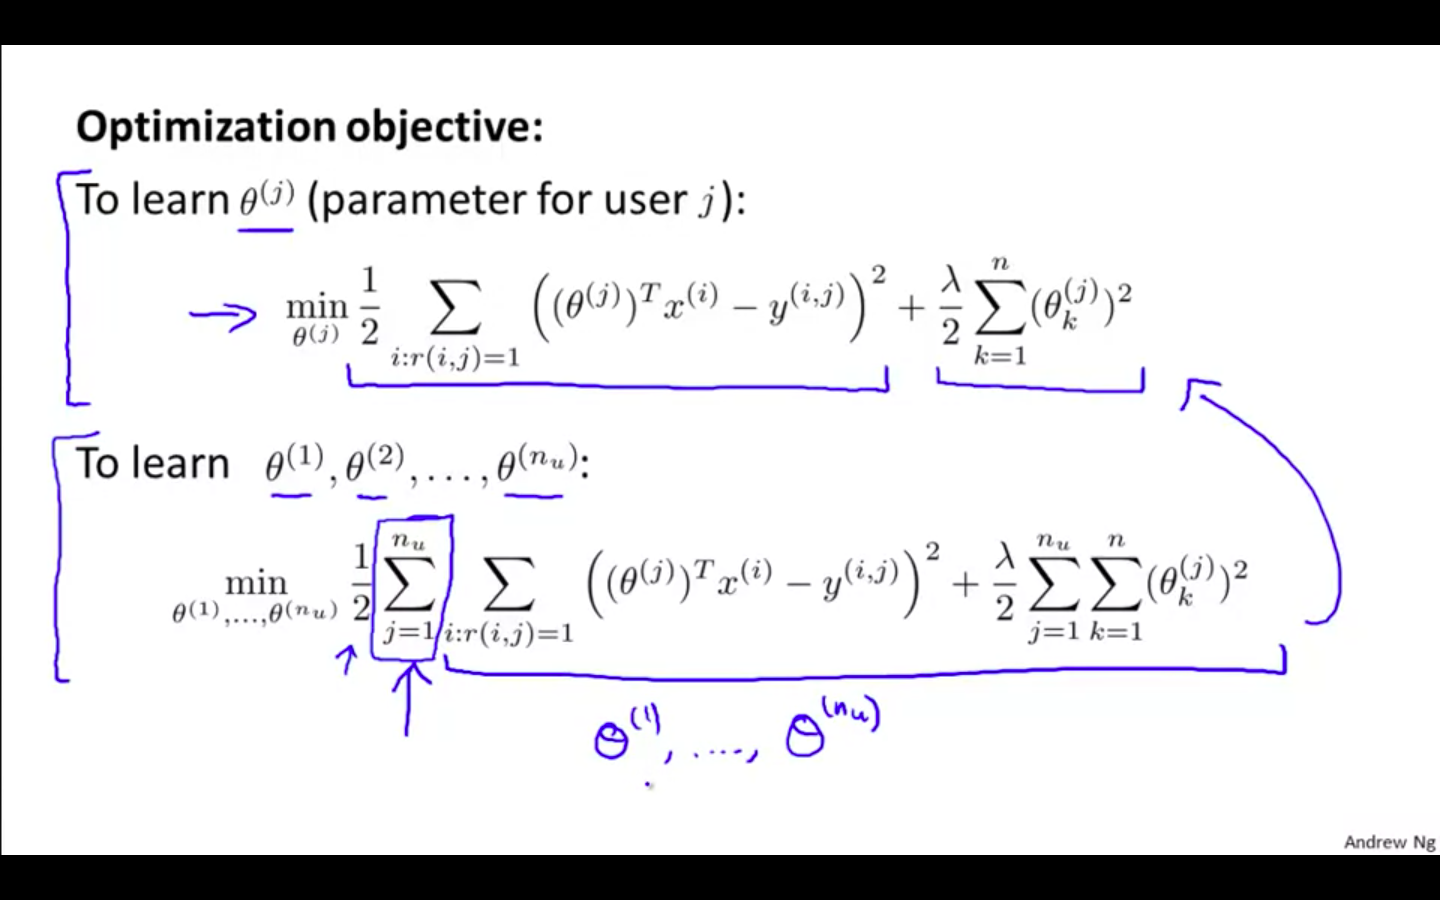
-
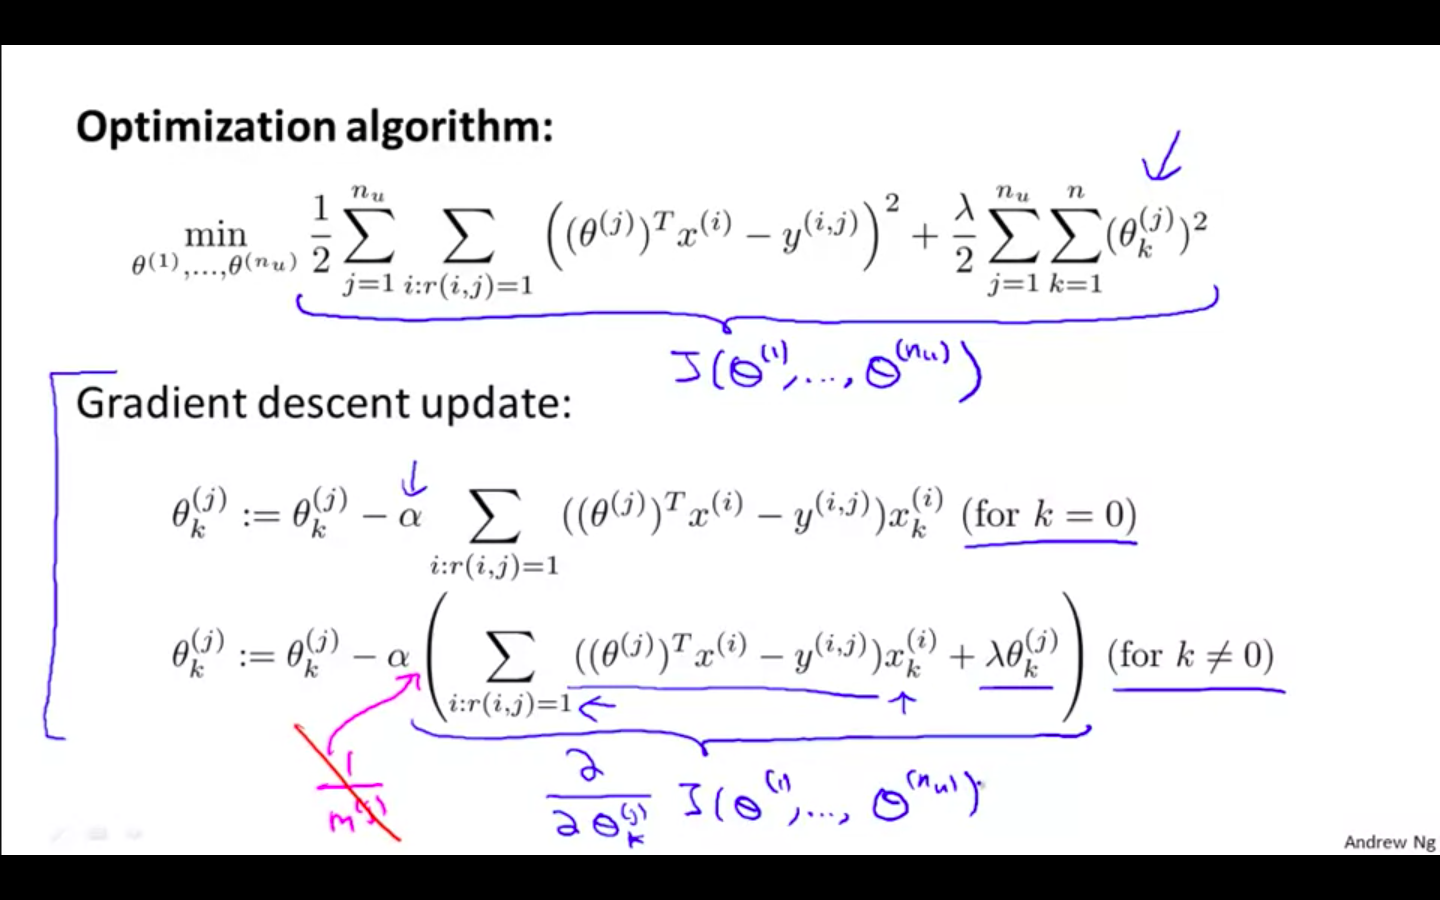
Gradient Descent Update
Collaborative Filtering
Collaborative Filtering
-
Problem Motivation
-
Optimisation Algorithm
-
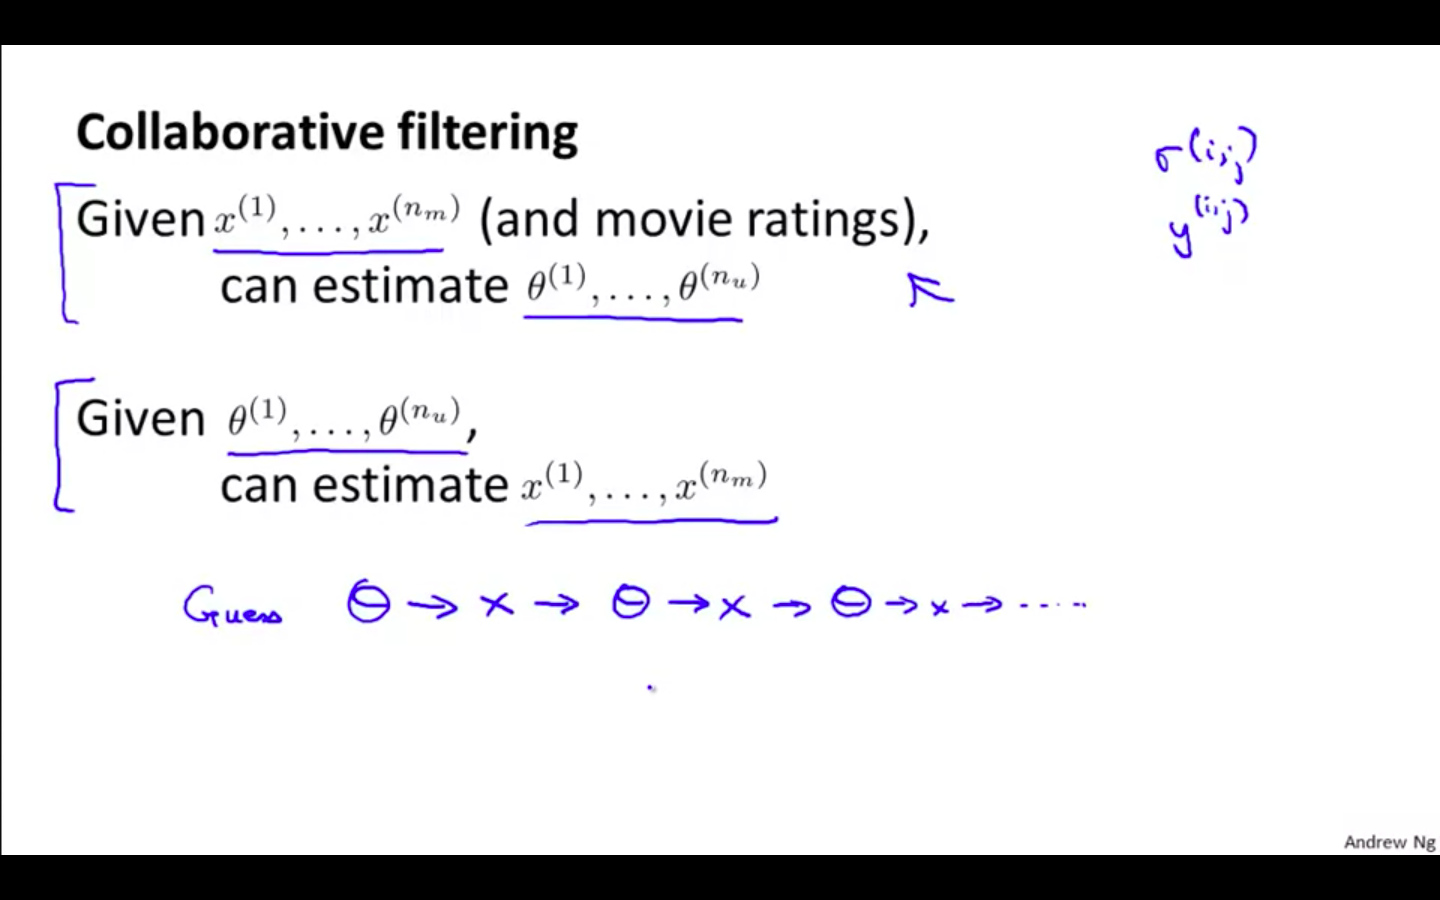
Collaborative Filtering
-
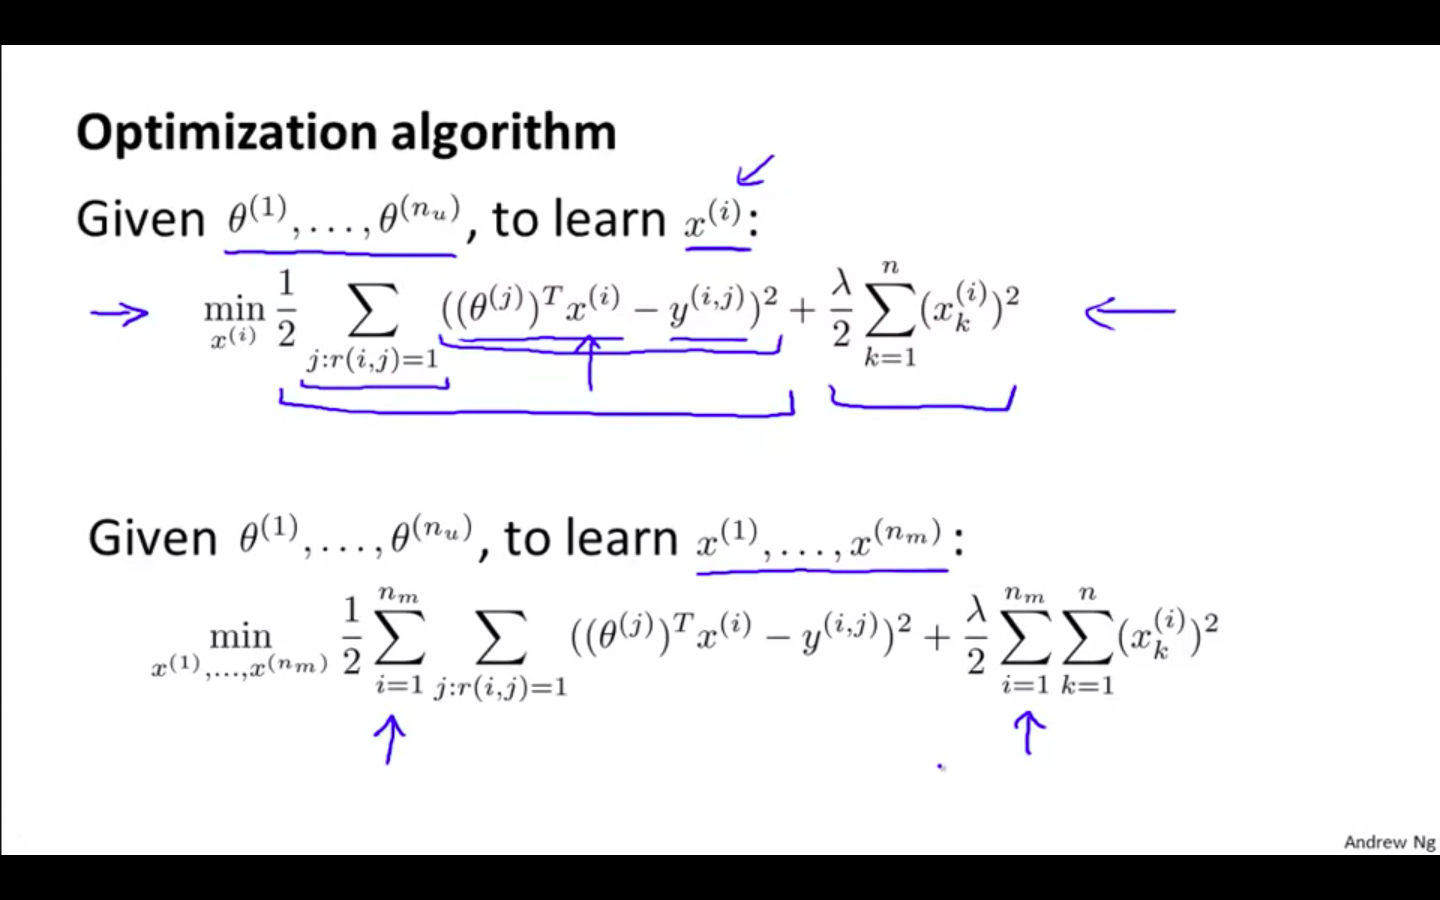
Given x, to learn theta
-
Given theta, to learn x
-
Continuous updating both values
-
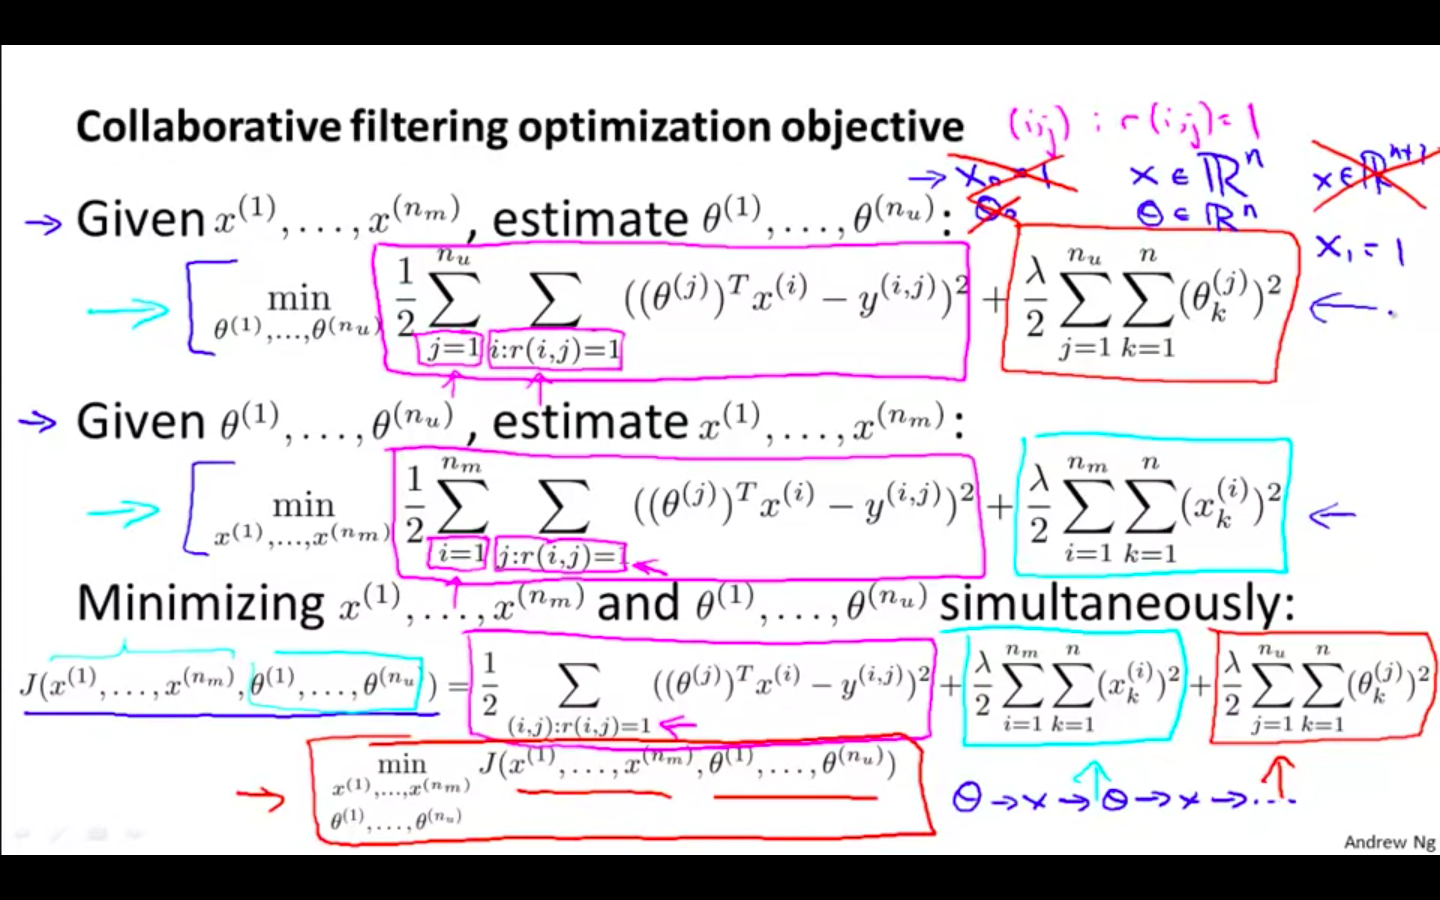
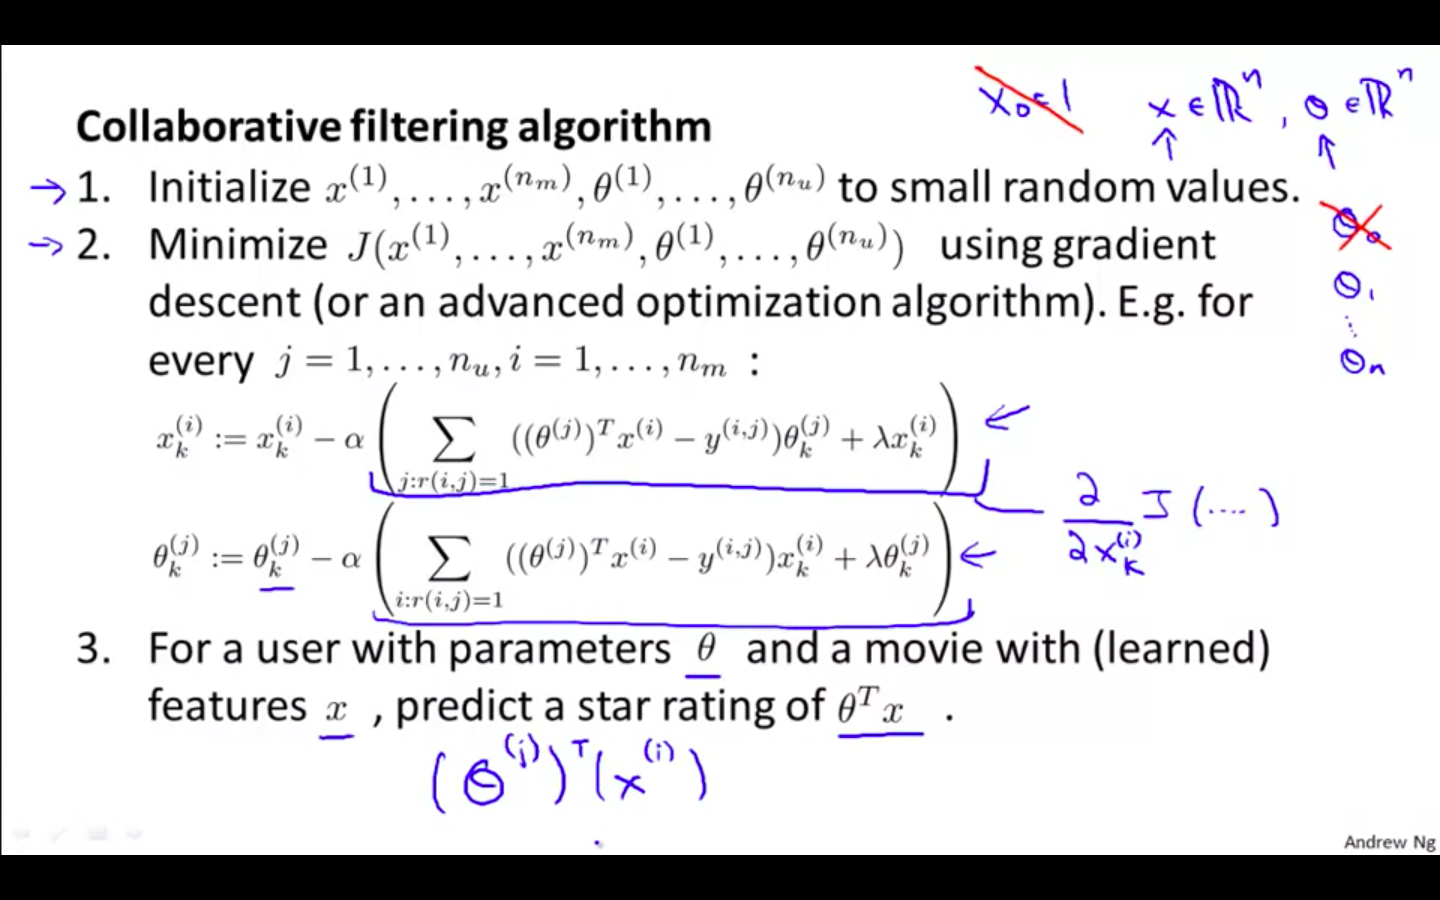
Collaborative Filtering Algorithm
-
Collaborated Formula
- Formula has been concatenated of the earlier formula
-
Collaborative Flow
-
Initialise x and theta to small random values
-
Minimise J ( x , theta ) using gradient descent ( or any other advance optimisation algorithm )
-
For a user with parameter theta and a movie with ( learned ) features x, predict a star rating of theta^T
-
Low Rank Matrix Factorisation
Vectorisation: Low Rank Matrix Factorisation
-
Collaborative Filtering
-
Low Rank Matrix Factorisation
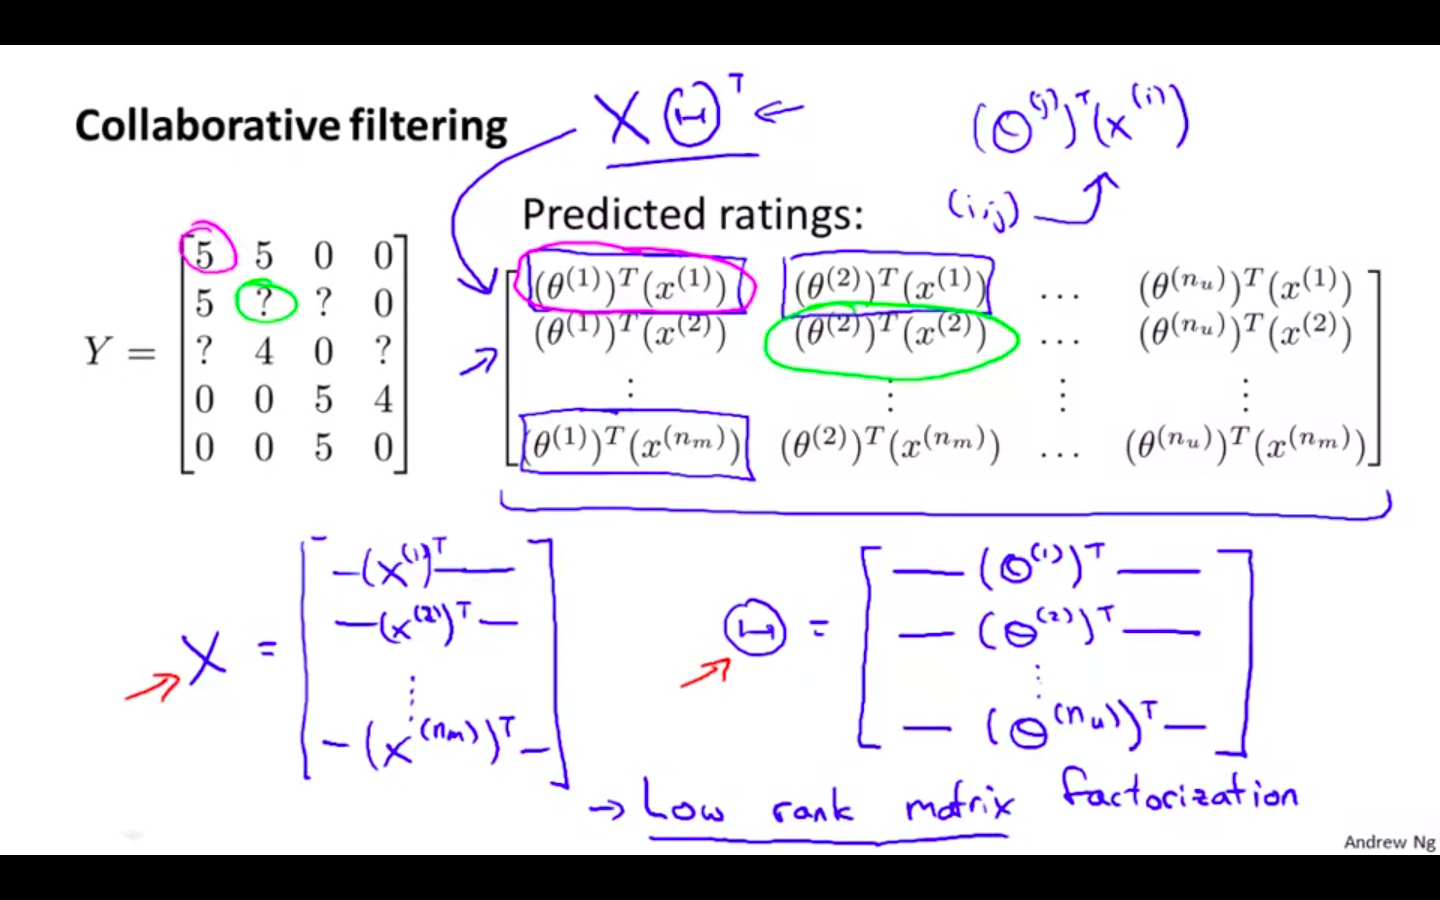
-
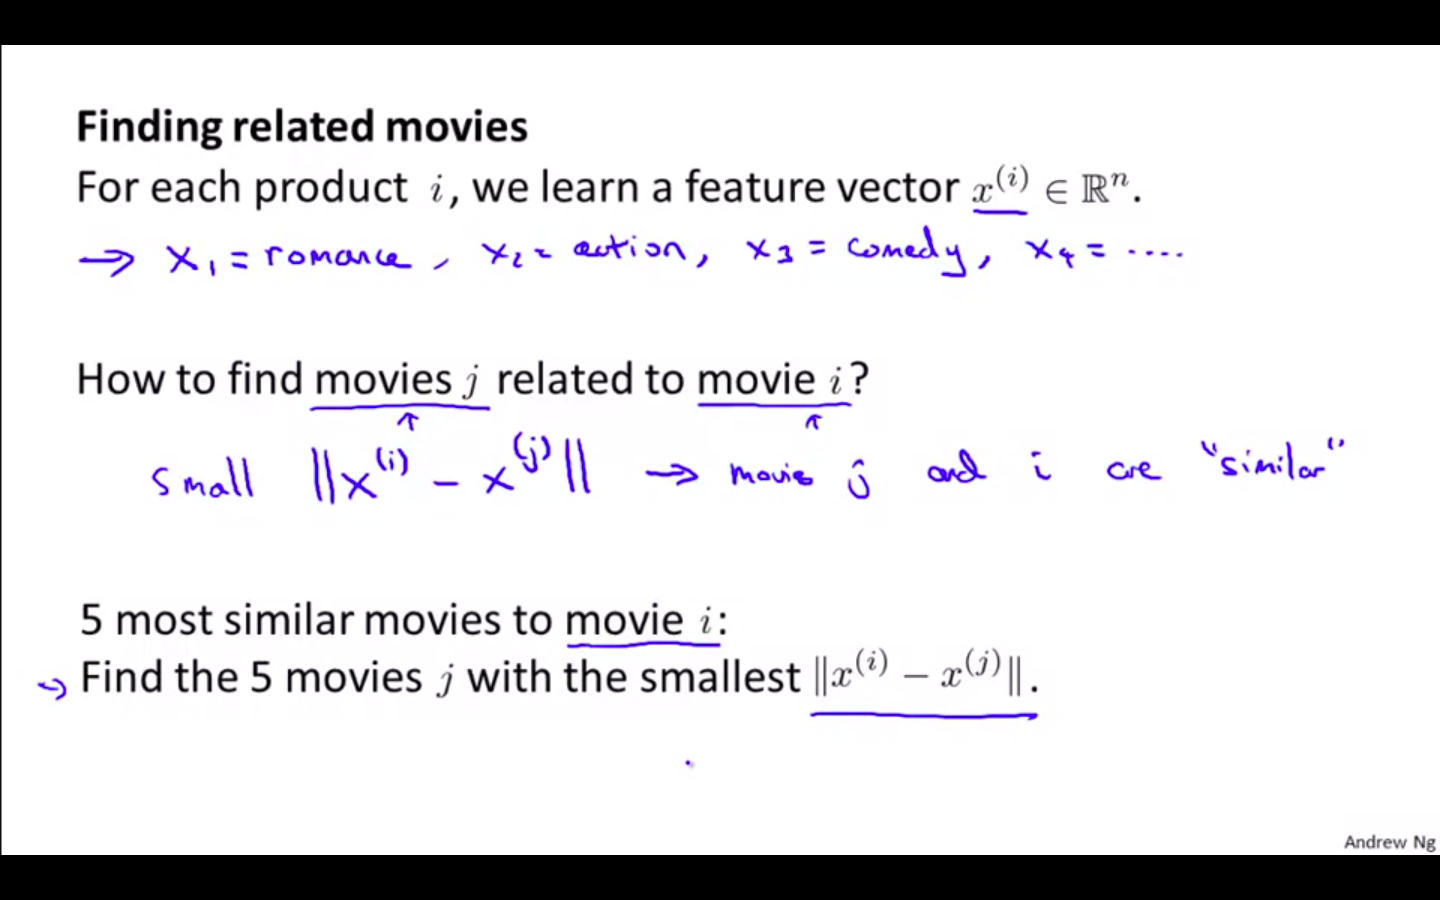
Finding Related Movies
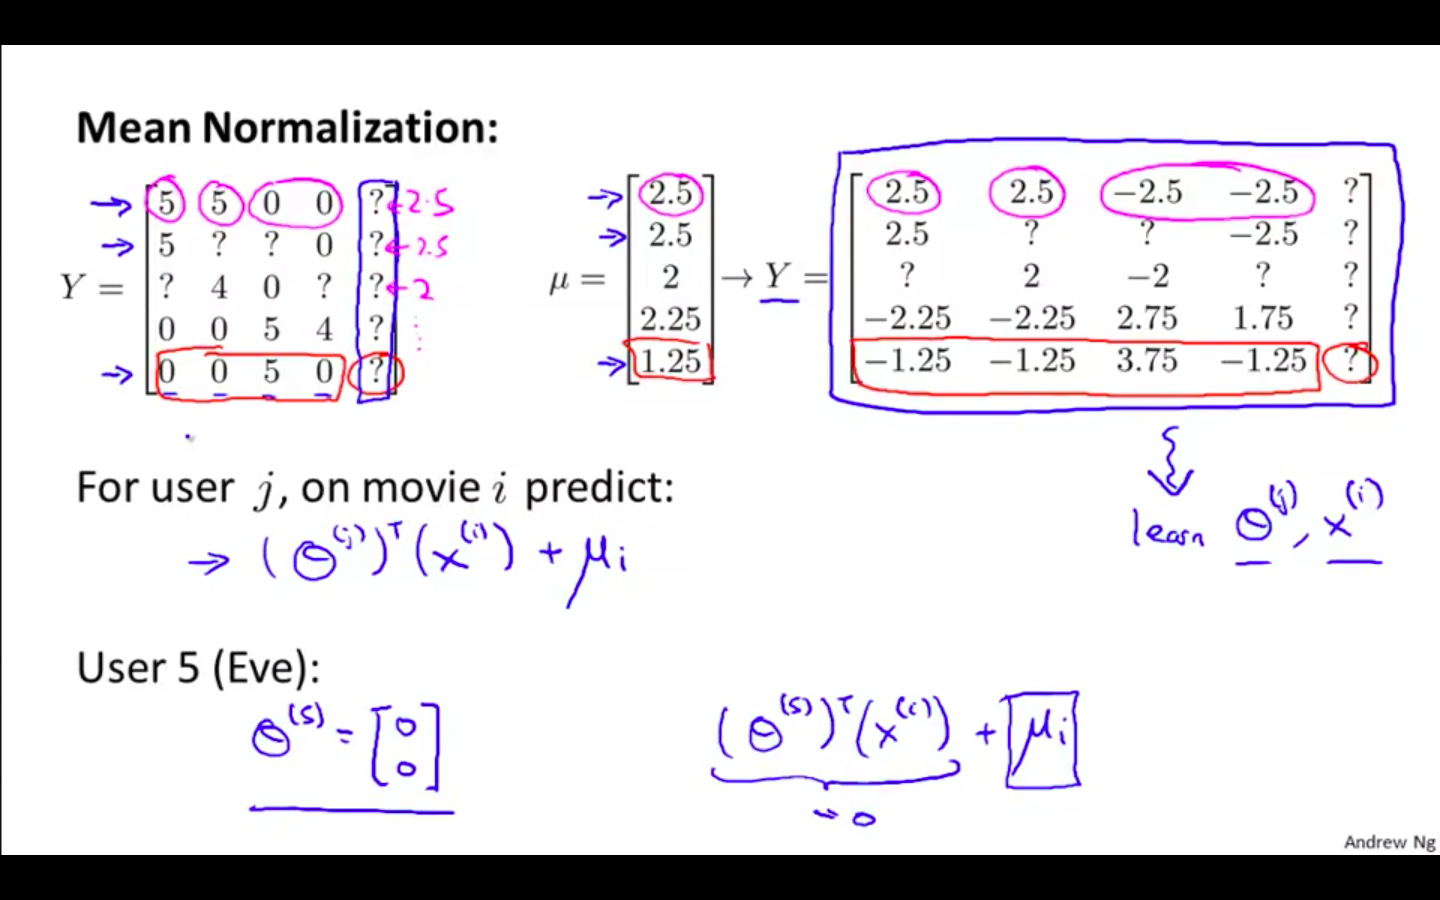
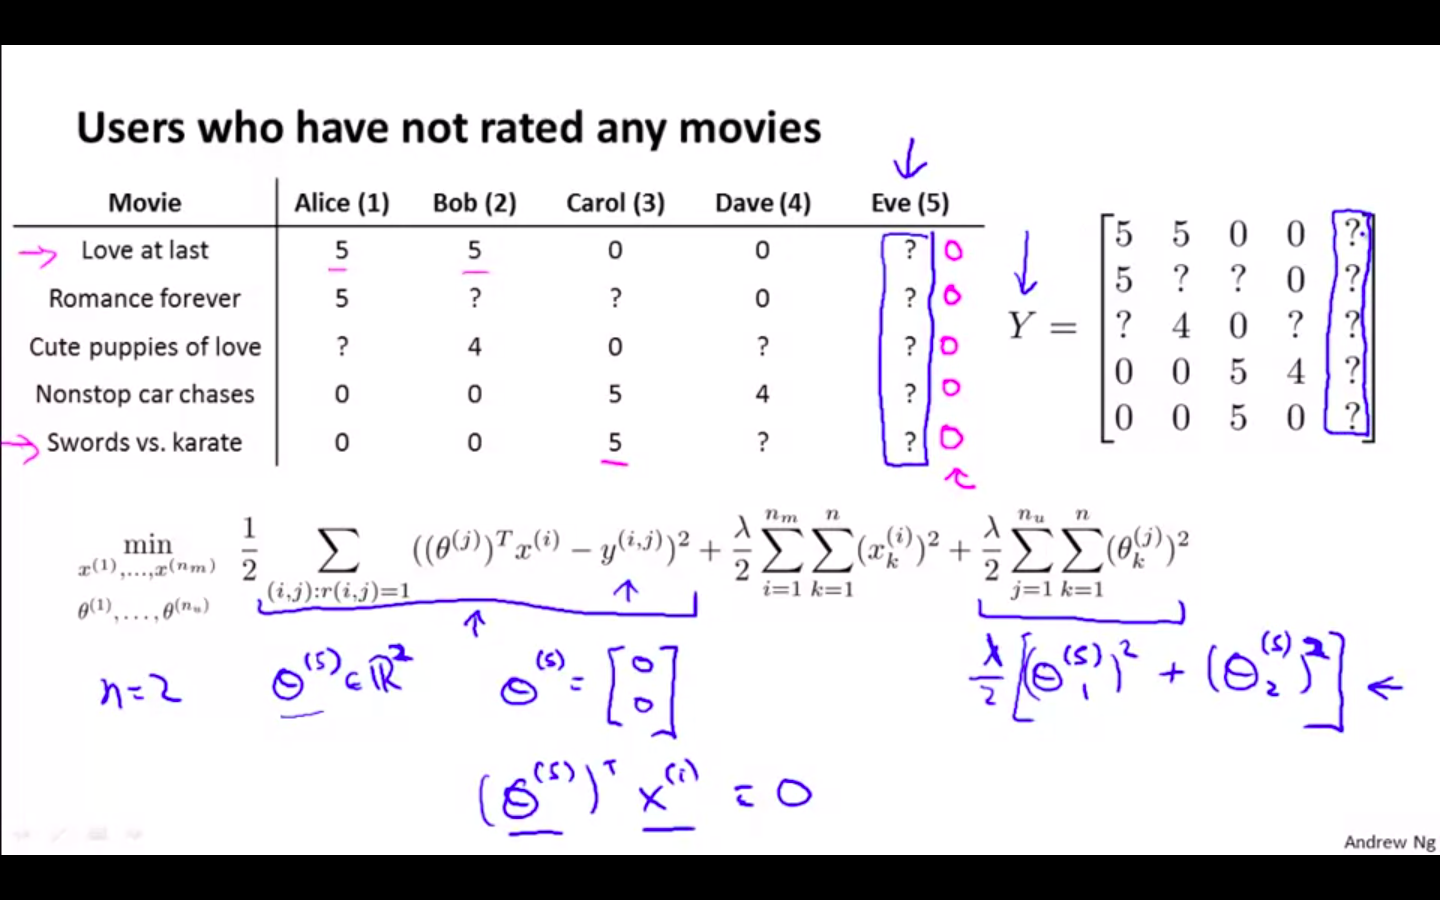
Implementation Detail: Mean Normalisation
-
Users who have not rated any movies
-
Mean Normalisation